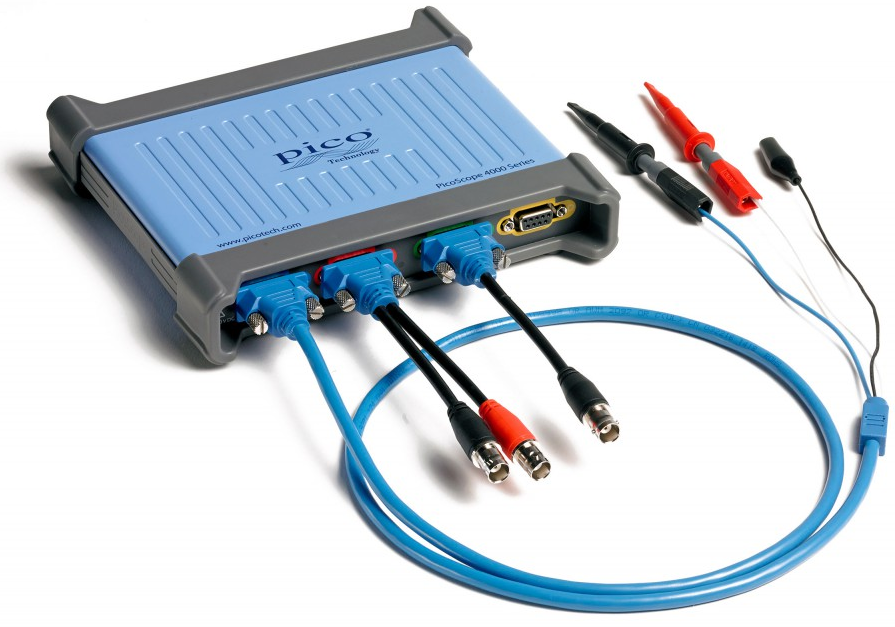
With four true differential inputs, 12 to 14-bit resolution and wide differential and common-mode voltage ranges, the PicoScope 4444 and its accessories offer accurate and detailed measurement for a multitude of applications.
Key features
4 high impedance differential inputs
20 MHz bandwidth
Flexible 12 and 14-bit resolution
256 MS deep memory
Measures non-grounded (floating) signals
Rejects common-mode noise
Intelligent probe interface
Low-voltage probe for millivolts to 50 V
1000 V CAT III probe for high-voltage applications
Typical applications
Safely probe single and 3-phase voltage and current
Measuring power drawn by mobile and IoTdevices
Mains quality testing
SMPS design
Hybrid and electric vehicle design
Motor drives and inverters
Biomedical electronics
Measuring differential signals (CAN, balanced audio) with a single channel
High-end oscilloscope
At the heart of every PicoScope 4444 is an advanced oscilloscope that offers everything you would expect and much more including:
10 000 waveform circular buffer
Up to 100 000 waveforms per second update rate
Serial bus decoding
Mask limit testing
Advanced math and filtering
Measurements with statistics
Advanced digital triggering
USB 3.0 connected and powered
More details on the above and many other options can be found under the Features tab.
Intelligent differential inputs
With a traditional oscilloscope probe, single-ended measurements are made between a high-impedance input and a low-impedance ground.
With a differential oscilloscope, measurements are made between two high-impedance inputs, allowing measurements to be made across components and test points where neither side is grounded. Differential inputs also reject common-mode noise: noise picked up equally on both high-impedance inputs is rejected.
Each of the four input channels on the PicoScope 4444 features an intelligent probe interface that detects and identifies compatible probes, and powers them where necessary. Each channel can have its own choice of voltage or current probe.
Non-attenuating probes allow high-resolution, low-noise measurement of signals ranging from millivolts to ±50 V. Attenuating probes allow signals up to 1000 V CAT III to be measured. Current probes are available for currents up to 2000 A.
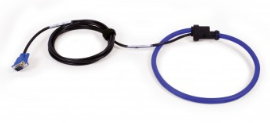
PicoConnect 441: Measure from millivolts to ±50 V
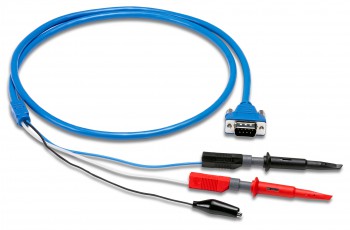
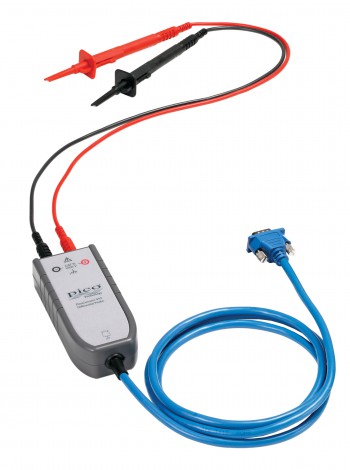
The PicoConnect 441 differential voltage probes are suitable for voltages up to ±50 V (for higher voltages see the PicoConnect 442). The probes are fitted with industry-standard 4 mm connectors and supplied with detachable sprung hook probe tips. Other 4 mm accessories such as multimeter probes and crocodile clips are available separately.
As well as measuring non-grounded voltage signals, differential inputs are ideal for measuring current through sensing resistors. As neither side needs to be grounded, they can make high-side measurements. The sensitive input ranges, high resolution and fast sampling are ideal for measuring fast-changing currents in battery-powered and IoT devices.[Human heartbeat captured on oscilloscope]Human heartbeat captured on PicoScope 4444
The high-impedance, high-resolution inputs are also suited to biological and scientific research, as they allow measurements on low-level millivolt signals (2 mV/div at 12 bits) in the presence of common-mode noise without the need for expensive differential preamplifiers or differential oscilloscope probes. The probe is constructed with twinax cable (twisted-pair inner conductors with an outer shield) to ensure a high common-mode rejection ratio (CMRR). The outer screen of the cable can optionally be connected to a signal ground to improve screening and further reduce noise pickup.
The PicoConnect 441 probes are also ideal for measuring differential signal sources such as CAN bus and balanced audio on a single channel, and can be used to directly measure from bridge-type sensors such as load cells and pressure sensors.
PicoConnect 442: 1000 V CAT III probes
The PicoConnect 442 is an attenuating differential voltage probe that increases the input range to 1000 V to allow the safe and cost-effective measurement of single-phase, three-phase and other signals, such as those found in motor drives and inverters.
The PicoConnect 442 probe requires no power supply or batteries. This makes it ideal for mains quality measurement and other long-term measurements.
The differential inputs of the PicoScope 4444 allow each channel to measure signals with different common-mode voltages. As an example, consider the battery pack in an electric vehicle. You can measure across the whole pack using one channel set to an input range of ±500 V, and at the same time set the other channels to ±5 V to measure across individual cells. This arrangement allows you to take advantage of the full resolution of the oscilloscope.
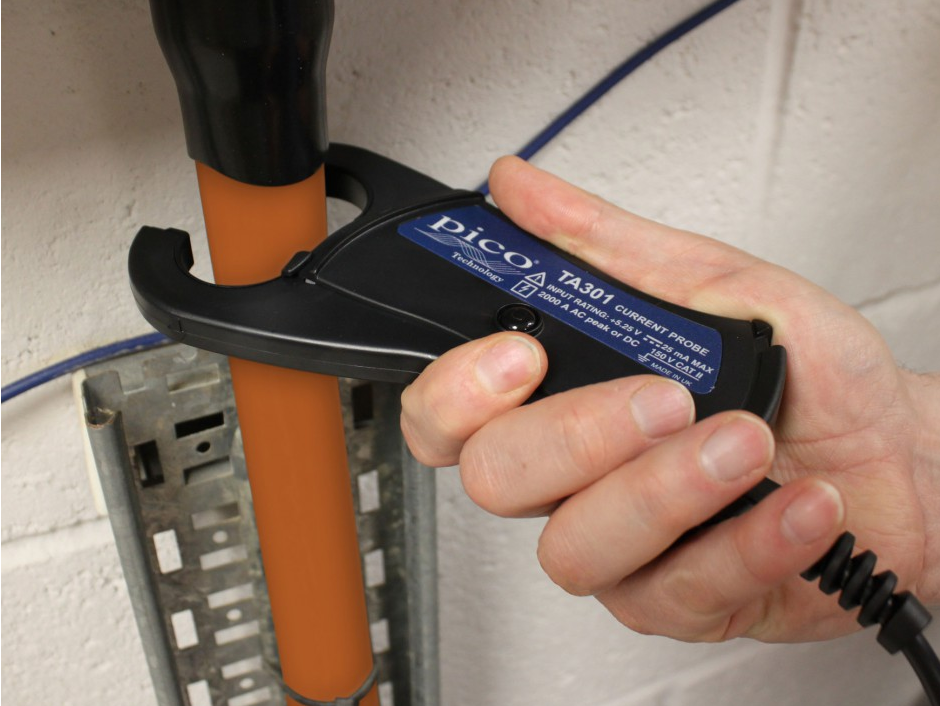
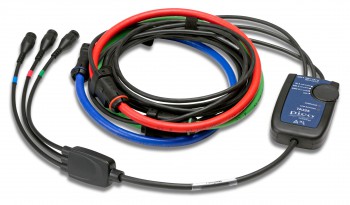
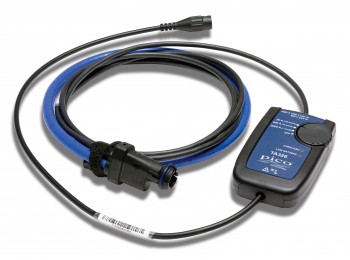
Three current probes with intelligent probe interface
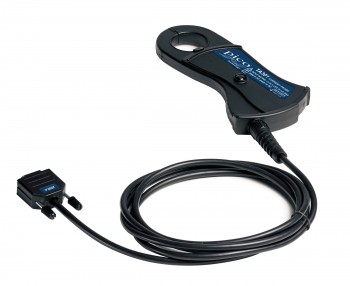
Three different current probes are available with Pico D9 interfaces. TA300 and TA301 use the Hall effect to measure AC and DC currents without direct connection to the cable, and the TA368 uses the Rogowski principle for AC-only measurements. The intelligent probe interface powers the probes, so no batteries are required. It also means that when you connect either probe, the PicoScope software identifies it and configures the oscilloscope to read in amperes.
The TA300 current probe is a 40 A probe suitable for measuring signals from DC to 100 kHz. It is a precision probe for smaller currents and can resolve down to a few milliamps.
The TA301 current probe is a switched-range 200/2000 A probe suitable for measuring signals from DC to 20 kHz bandwidth.
The TA368 current probe is a single-range 2000 A AC probe suited for measuring signals above DC to 20 kHz, and because the probe is rated to 1000 V CAT III, it is ideal for making mains current measurements.
In addition to the above probes, Pico stocks a wide range of AC and DC current clamps with BNC connectors that can be connected to the PicoScope 4444 using the TA271 D9 to BNC adaptor.
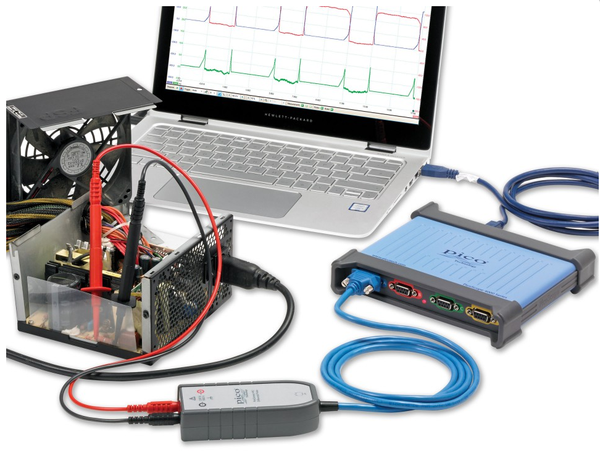
Powerful and portable
Just load the software, plug in the USB cable and you are up and running in minutes. Saving and printing are easy: PicoScope users can take copying waveforms into reports for granted.
On the bench, a PicoScope saves valuable space and can be placed right by the unit under test.
Laptop users benefit even more: with no power supply required you can now carry an oscilloscope with you all the time in your laptop bag. Perfect for the engineer on the move.
With our scopes, high-end features such as serial decoding, mask limit testing, advanced math channels and segmented memory are all included in the price.
To protect your investment, both the PC software and firmware inside the scope can be updated. Pico has a 26-year history of providing new features for free through software downloads. We deliver on our promises of future enhancements year after year.
Users of our products reward us by becoming lifelong customers and frequently recommending us to their colleagues
PicoScope 4444 differential oscilloscope features
True differential measurements in high resolution
The PicoScope 4444’s four inputs allow you to make true differential measurements. The maximum input range at full scale is ±50 V (±1000 V CAT III using the PicoConnect 442 probe), and the maximum common-mode range is also ±50 V (also ±1000 V with the PicoConnect 442 probe). You can set the scope to measure at resolutions of 12 or 14 bits, far better than the 8-bit resolution typical of many oscilloscopes. The deep capture memory (up to 256 million samples shared by the active channels) is another advantage, allowing you to carry out long captures without lowering the sampling rate.
FFT spectrum analyzer
The spectrum view plots amplitude against frequency and is ideal for finding noise, crosstalk or distortion in signals. The spectrum analyzer in PicoScope is of the Fast Fourier Transform (FFT) type which, unlike a traditional swept spectrum analyzer, can display the spectrum of a single, non-repeating waveform.
A full range of settings gives you control over the number of spectrum bands (FFT bins), window types, scaling (including log/log) and display modes (instantaneous, average, or peak-hold).
You can display multiple spectrum views alongside oscilloscope views of the same data. A comprehensive set of automatic frequency-domain measurements can be added to the display, including THD, THD N, SNR, SINAD and IMD. A mask limit test can be applied to a spectrum and you can even use the AWG and spectrum mode together to perform swept scalar network analysis.
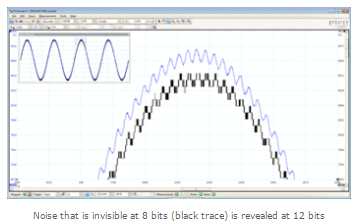
High resolution offers 64x more detail
The PicoScope 4444 can sample at speeds of up to 400 MS/s with 12-bit high resolution, this is 16 times more vertical resolution than traditional 8-bit oscilloscopes (4096 vertical levels vs 256). The example shows how with a 12-bit oscilloscope (blue trace) you can zoom in to reveal details of the signal that are not visible on an 8-bit oscilloscope (black trace).
The PicoScope 4444 hardware can also be switched into a 14-bit mode (maximum sampling rate drops to 50 MS/s) offering 64 times more vertical resolution than traditional 8-bit oscilloscopes.
Once you have seen high-resolution waveforms on a high-resolution PC monitor you will never want to use a traditional benchtop oscilloscope with its small display again.
As well as improved oscilloscope traces, high resolution offers big benefits when performing spectrum analysis offering an additional 20 dB dynamic range on the spectrum over 8-bit oscilloscopes. Signals that were previously hidden in the noise floor are now clearly visible and the spectrum becomes a powerful tool to track down the causes of noise.
Deep-memory oscilloscopes
The PicoScope 4444 oscilloscope has a huge buffer memory of 256 million samples – many times larger than competing scopes of either PC-based or traditional benchtop design.
Deep memory produces several benefits: fast sampling at long timebases, timebase zoom, and memory segmentation to let you capture a sequence of events. Deep memory oscilloscopes are also ideal for serial decoding applications as they allow the capture of many thousands of frames of data.
Most other scopes with large buffers slow down when using deep memory, so you have to manually adjust the buffer size to suit each application. You don’t have to worry about this with PicoScope deep-memory scopes as hardware acceleration ensures you can always use deep memory while displaying at full speed.
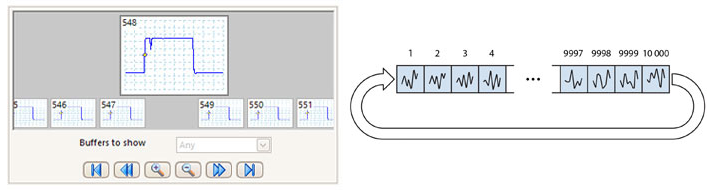
Waveform buffer and navigator
Ever spotted a glitch on a waveform, but by the time you’ve stopped the scope it has gone? With PicoScope you no longer need to worry about missing glitches or other transient events. PicoScope can store the last ten thousand oscilloscope or spectrum waveforms in its circular waveform buffer.
The buffer navigator provides an efficient way of navigating and searching through waveforms, effectively letting you turn back time. Tools such as mask limit testing can also be used to scan through each waveform in the buffer looking for mask violations.
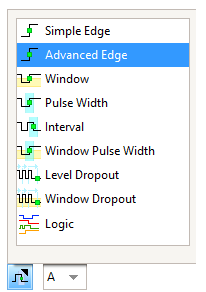
Digital triggers
The majority of digital oscilloscopes still use an analog trigger architecture based on comparators. This causes time and amplitude errors that cannot always be calibrated out and often limits the trigger sensitivity at high bandwidths.
In 1991 Pico pioneered the use of fully digital triggering using the actual digitized data. This technique reduces trigger errors and allows our oscilloscopes to trigger on the smallest signals, even at the full bandwidth. Trigger levels and hysteresis can be set with high precision and resolution.
The reduced rearm delay provided by digital triggering, together with segmented memory, allows the capture of events that happen in rapid sequence. On many of our products, rapid triggering can capture a new waveform every microsecond until the buffer is full.
Hardware Acceleration Engine (HAL3)
Some oscilloscopes struggle when you enable deep memory; the screen update rate slows and controls become unresponsive. The PicoScope 4444 avoids this limitation with use of a dedicated hardware acceleration engine inside the oscilloscope. Its parallel design effectively creates the waveform image to be displayed on the PC screen. PicoScope oscilloscopes manage deep memory better than competing oscilloscopes, both PC-based and benchtop.
The PicoScope 4444 is fitted with third-generation hardware acceleration (HAL3). This speeds up areas of oscilloscope operation such as allowing waveform update rates in excess of 100 000 waveforms per second and the segmented memory/rapid trigger modes. The hardware acceleration engine ensures that any concerns about the USB connection or PC processor performance being a bottleneck are eliminated.
Hardware acceleration ensures fast screen update rates even when collecting 10,000,000 samples per waveform
100 000 waveforms per second
An important specification to understand when evaluating oscilloscope performance is the waveform update rate, which is expressed as waveforms per second. While the sample rate indicates how frequently the oscilloscope samples the input signal within one waveform, or cycle, the waveform capture rate refers to how quickly an oscilloscope acquires waveforms.
Oscilloscopes with high waveform capture rates provide better visual insight into signal behavior and dramatically increase the probability that the oscilloscope will quickly capture transient anomalies such as jitter, runt pulses and glitches – that you may not even know exist.
The PicoScope 4444 oscilloscope uses hardware acceleration to achieve up to 100 000 waveforms per second.
Signal integrity
Most oscilloscopes are built down to a price. PicoScopes are built up to a specification.
Careful front-end design and shielding reduces noise, crosstalk and harmonic distortion. Years of oscilloscope design experience can be seen in improved bandwidth flatness and low distortion.
We are proud of the dynamic performance of our products and publish our specifications in detail. The result is simple: when you probe a circuit, you can trust in the waveform you see on the screen.
PicoScope = PC oscilloscopes done properly.
PicoScope 4444 software
Advanced display
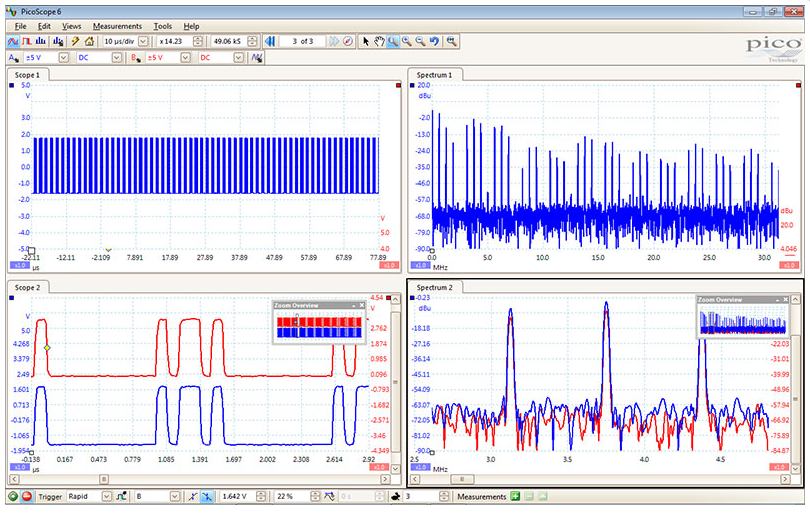
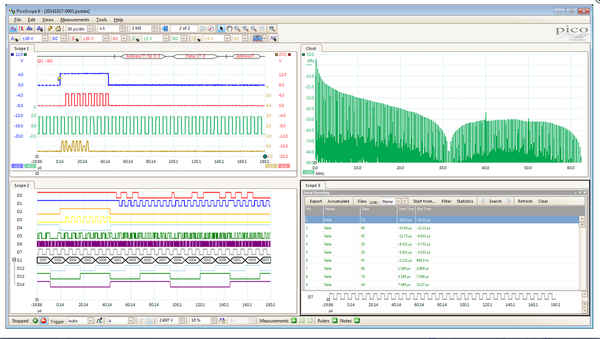
PicoScope software dedicates almost all of the display area to the waveform. This ensures that the maximum amount of data is seen at once. The viewing area is much bigger and of a higher resolution than with a traditional benchtop scope.
With a large display area available, you can also create a customizable split-screen display, and view multiple channels or different views of the same signal at the same time. As the example shows, the software can even show multiple oscilloscope and spectrum analyzer traces at once. Additionally, each waveform shown works with individual zoom, pan, and filter settings for ultimate flexibility.
The PicoScope software can be controlled by mouse, touchscreen or keyboard shortcuts.
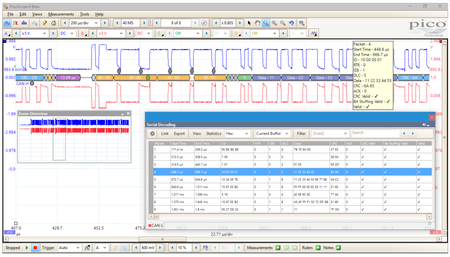
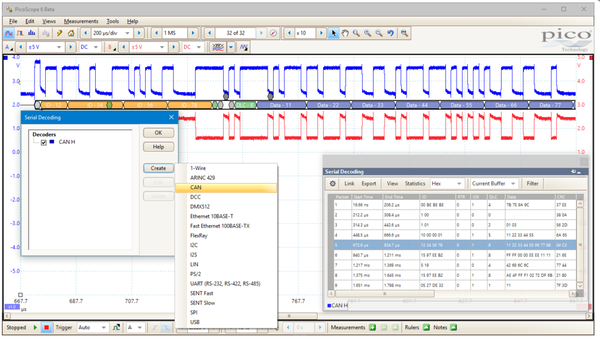
Serial bus decoding and protocol analysis
PicoScope can decode 1-Wire, ARINC 429, CAN, DCC, DMX512, Ethernet 10Base-T and 100Base-TX, FlexRay, I²C, I²S, LIN, PS/2, SENT, SPI, UART (RS-232 / RS-422 / RS-485), and USB 1.1 protocol data as standard, with more protocols in development and available in the future with free-of-charge software upgrades.
Graph format shows the decoded data (in hex, binary, decimal or ASCII) in a data bus timing format, beneath the waveform on a common time axis, with error frames marked in red. These frames can be zoomed to investigate noise or signal integrity issues.
Table format shows a list of the decoded frames, including the data and all flags and identifiers. You can set up filtering conditions to display only the frames you are interested in or search for frames with specified properties. The statistics option reveals more detail about the physical layer such as frame times and voltage levels. PicoScope can also import a spreadsheet to decode the data into user-defined text strings.
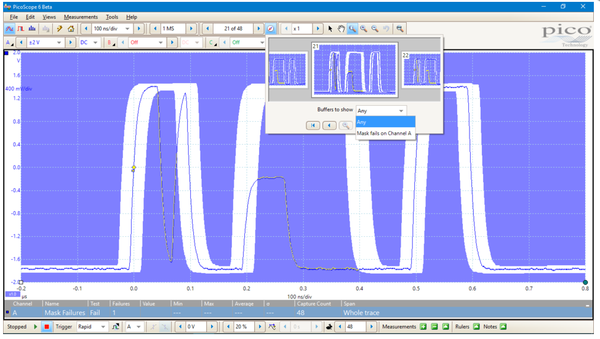
Mask limit testing
Mask limit testing allows you to compare live signals against known good signals, and is designed for production and debugging environments. Simply capture a known good signal, draw a mask around it, and then attach the system under test. PicoScope will check for mask violations and perform pass/fail testing, capture intermittent glitches, and can show a failure count and other statistics in the Measurements window.
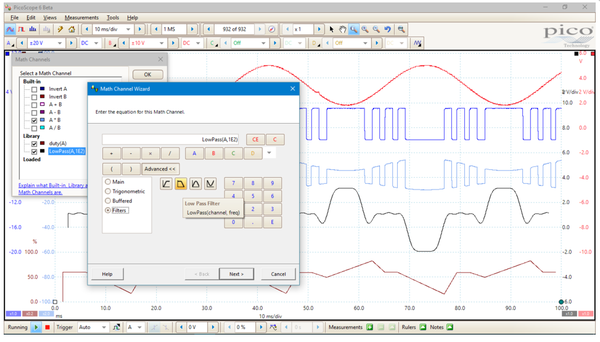
Math channels and filters
On many oscilloscopes waveform math just means simple calculations such as A B. With a PicoScope it means much, much more.
With PicoScope 6 you can select simple functions such as addition and inversion, or open the equation editor to create complex functions involving filters (lowpass, highpass, bandpass and bandstop filters), trigonometry, exponentials, logarithms, statistics, integrals and derivatives.
Waveform math also allows you to plot live signals alongside historic peak, averaged or filtered waveforms.
You can also use math channels to reveal new details in complex signals. An example would be to graph the changing duty cycle or frequency of your signal over time.
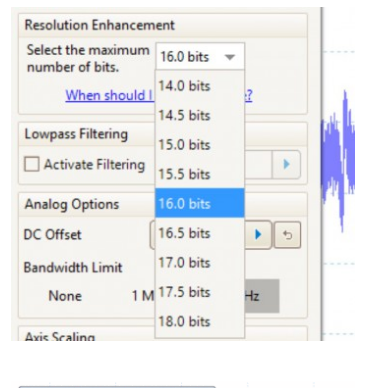
Resolution enhancement
Resolution enhancement is a technique for increasing the effective vertical resolution of the scope at the expense of high-frequency detail. It is useful for resolving small signal details and for reducing unwanted noise. Unlike waveform averaging it can be used on single-shot signals.
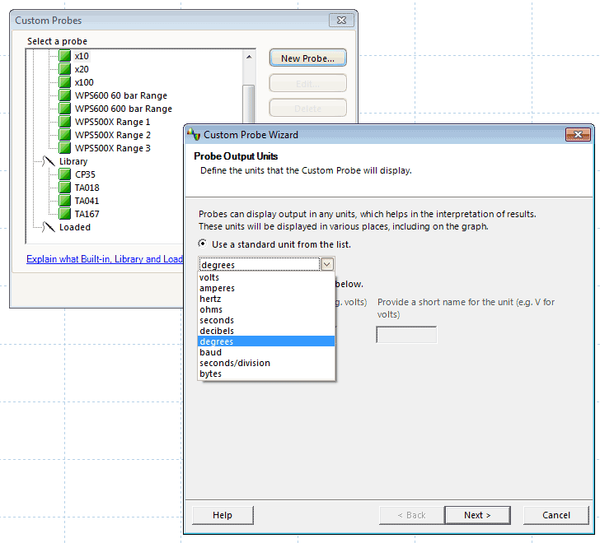
Custom probes in PicoScope oscilloscope software
The custom probes feature allows you to correct for gain, attenuation, offsets and nonlinearities in probes, sensors or transducers that you connect to the oscilloscope. This could be used to scale the output of a current probe so that it correctly displays amperes. A more advanced use would be to scale the output of a nonlinear temperature sensor using the table lookup function.
Definitions for standard Pico-supplied oscilloscope probes and current clamps are included. User-created probes may be saved for later use.
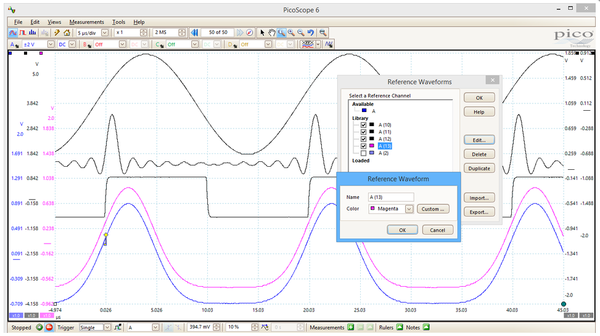
Reference waveforms
With PicoScope you can display stored waveforms alongside live traces. You can apply all the same functions to the reference waveforms as you can to live waveforms, such as automatic and manual measurements, scaling and offset, and exporting to a file. Reference waveforms are especially useful for production testing and diagnostics, where they allow you to compare waveforms from the equipment under test with known good waveforms.
You can also shift the timebase of a reference waveform relative to live waveform data: click the color-coded axis control button at the bottom of the y axis for the reference waveform and adjust the box marked ‘Delay’.
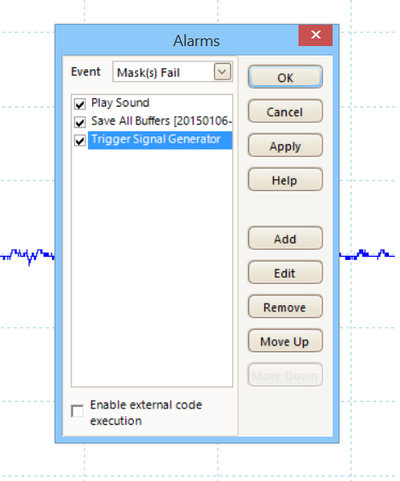
Alarms
PicoScope can be programmed to execute actions when certain events occur.
The events that can trigger an alarm include mask limit fails, trigger events and buffers full.
The actions that PicoScope can execute include saving a file, playing a sound, or executing a program.
Alarms, coupled with mask limit testing, help to quickly validate signal quality in electronic system designs.
High-speed data acquisition and digitizing
The software development kit (SDK) allows you to write your own software and includes drivers for Microsoft Windows and beta drivers for Apple Mac (OS X) and Linux (including Raspberry Pi).
Example code shows how to interface to third-party software packages such as Microsoft Excel, National Instruments LabVIEW and MathWorks MATLAB.
The drivers support USB data streaming, a mode which captures gap-free continuous data over USB direct to the PC’s RAM or hard disk at rates of up to 160 MS/s (2 channels at 80 MS/s each or 4 channels at 40 MS/s etc). Capture size is limited only by available PC storage. Sampling rates in streaming mode are subject to PC specifications and application loading.
Powerful tools provide endless options
Your PicoScope is provided with many powerful tools to help you acquire and analyze waveforms. While these tools can be used on their own, the real power of PicoScope lies in the way they have been designed to work together.
As an example, the rapid trigger mode allows you to collect 10 000 waveforms in a few milliseconds with minimal dead time between them. Manually searching through these waveforms would be time-consuming, so just pick a waveform you are happy with and let the mask tools scan through for you. When done, the measurements will tell you how many have failed and the buffer navigator allows you to hide the good waveforms and just display the problem ones. This video shows you how.
Perhaps instead you want to plot changing duty cycle as a graph? How about outputting a waveform from the AWG and also automatically saving the waveform to disk when a trigger condition is met? With the power of PicoScope the possibilities are almost endless. To find out even more about the capabilities of PicoScope software, visit our A to Z of PC Oscilloscopes.
PicoScope 4444 differential oscilloscope example applications
There are many measurement applications that benefit from a differential oscilloscope. Listed below are a few examples.
Power quality - spikes, noise, dips and interruptions
Disturbances on the mains supply can cause a variety of problems ranging from computers crashing to, in more extreme cases, equipment damage.
The PicoScope 4444 is ideal for the long-term monitoring of single-phase and three-phase systems to spot and record any variation from the norm.
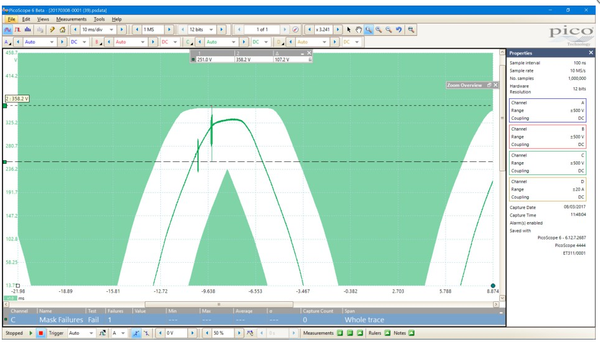
The waveform opposite shows the voltage of a three-phase supply (plus the neutral return current). If the voltage waveform crosses into the shaded area, the alarm function beeps and the waveform is stored for later review.[Mains voltage glitch waveform]A closer look reveals a short 107 V spike complete with the time/date it occurred.
Tests can be run for days or even weeks and the resulting high-resolution waveforms help identify whether mains quality is a factor.
The timestamp of saved problem waveforms often helps identify whether the problem is internal (which can be an early indicator of equipment failure), external but local (such as a nearby factory) or a generation issue.
5 mask failures were detected in 70k waveform updates
A closer look reveals a short 107 V spike complete with the time/date it occurred
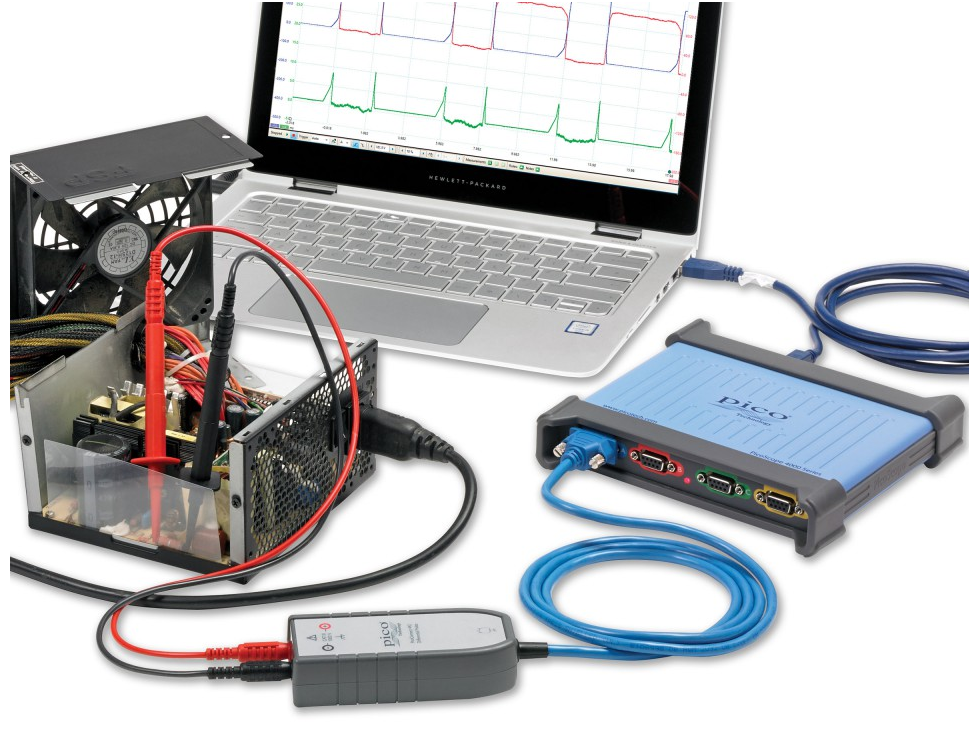
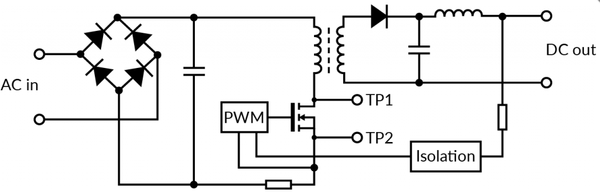
Switch mode power supply design
Switch mode power supplies are notoriously difficult to troubleshoot and characterize using grounded input oscilloscopes, as much of the circuitry is floating or electrically isolated and often at mains voltage levels.
The PicoScope 4444 differential inputs give you the confidence to probe across circuits and components without concern about shorting floating voltages to ground.
High resolution and vertical zoom capability allows visualization and measurement of low voltages in the presence of much higher voltage swings.
A range of voltage and current probes allow visualization of power waveforms in all stages of the power supply.
PicoConnect 441 probes are ideal for work with low voltage SMPS, PicoCOnnect 442 (shown) for voltages up to 1000 V.
Measuring differential signals
Differential signals have higher noise immunity and can be transmitted over longer distances than single-ended ones. Applications ranging from balanced audio through to serial data communications benefit from being measured with a differential input oscilloscope.
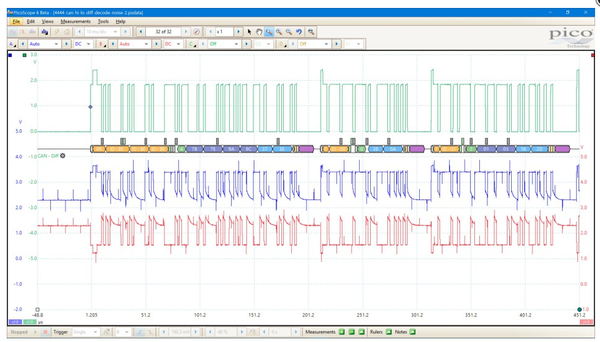
In the example shown, an automotive CAN bus waveform with excessive noise has been captured. The blue and red traces show CAN low and CAN high respectively. The green trace is a differential measurement across CAN high and low which has then been decoded to show the data contained.
The advantages of making a differential measurement (over using two channels and then using A-B maths) are twofold. First, only one channel is required, so up to four different serial buses can be captured and decoded. Second, the high common mode rejection ratio (CMRR) effectively removes the common mode noise, ensuring that the signal you are seeing matches that seen by the CAN bus transceiver.
CAN bus waveform
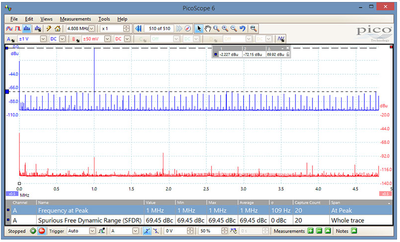
Mains harmonic measurement
AC power to homes, factories and offices is normally delivered at a frequency of 50 or 60 Hz, depending on the region of the world where you live. Power generation companies are obliged to deliver “clean” sinusoidal supply voltages within certain limits set by national regulatory bodies. If the load presented by the consumer is linear, providing the maximum current is not exceeded, the network will run fine. However, many modern devices do not present linear loads to the AC supply. Instead they take “bites” out of the supply waveform, so the current drawn includes harmonics of the 50 or 60 Hz fundamental supply frequency.
Harmonics are a distortion of the normal electrical current waveform. Switch mode power supplies (SMPS), variable speed motors and drives, lighting controls, personal computers, TVs and battery chargers are examples of nonlinear loads.
SMPS contribute a large part of the non-linear electrical load on most electrical distribution systems. For example, all computer systems use SMPS that convert utility AC voltage to regulated low-voltage DC for internal electronics. These non-linear power supplies draw current in short, high-amplitude pulses that create significant distortion in the electrical current and voltage wave shape – harmonic distortion, measured as total harmonic distortion (THD). The distortion travels back into the power source and can affect other equipment connected to the same source.
Illustration of a harmonic content in a 50Hz power distribution system
Blue trace is mains voltage, red is current drawn. Spectrum plot (lower) shows harmonic distortion
Most power systems can accommodate a certain level of harmonic currents, but experience problems when harmonics become a significant component of the overall load. As higher frequency harmonic currents flow through the power system, they can cause problems and damage, such as:
Overheating of electrical distribution equipment, cables, transformers, etc.
High voltages and circulating currents caused by harmonic resonance
Equipment malfunctions due to excessive voltage distortion
Increased internal energy losses in connected equipment, leading to component failure and shortened life span
False tripping of circuit breakers
Metering errors
Fires in wiring and distribution systems
Harmonics are currents or voltages with frequencies that are integer multiples of the fundamental power frequency. If the fundamental power frequency is 50 Hz, then the second harmonic is 100 Hz, the third is 150 Hz and so on.
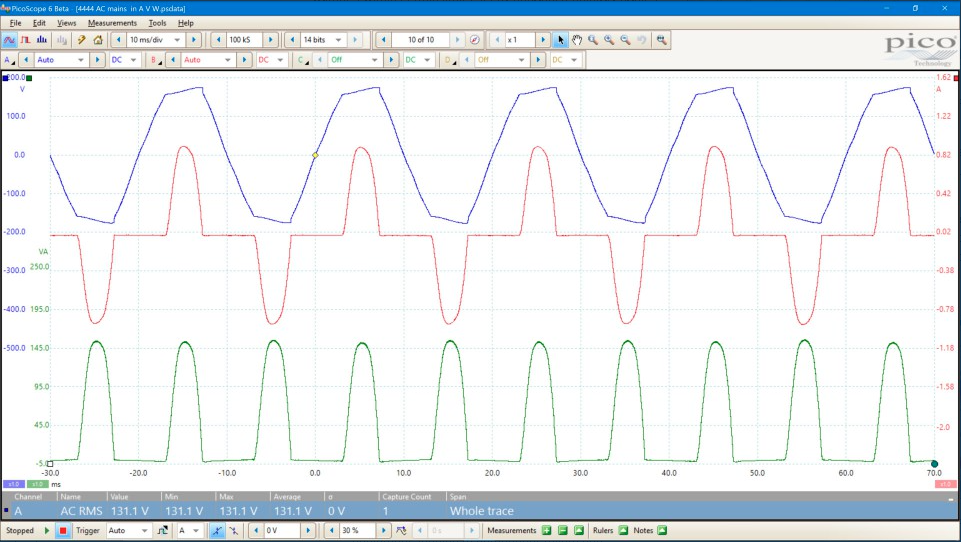
The PicoScope 4444 is ideal for measuring current and voltage harmonics from single and three-phase systems. The oscilloscope allows the waveforms to be viewed in the time domain and the spectrum allows the harmonics to be displayed and THD to be automatically measured.
Blue is mains voltage, red is current and green is power. The non linear nature of the load has distorted the sinusoidal supply voltage.
Blue trace is mains voltage, red is current drawn. Spectrum plot (lower) shows harmonic distortion
Measuring the power consumption of mobile and IoT devices
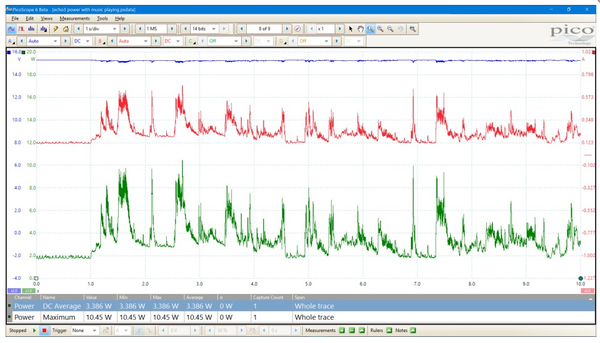
Many electronic devices draw low levels of current when idle and then consume orders of magnitude more when active and transmitting. This application example looks at the current drawn by an Amazon Echo smart speaker but the techniques used apply to virtually any mobile, battery-powered or IoT device.
The high resolution, fast sampling and differential inputs make the PicoScope 4444 ideal for power measurement. Blue trace is supply voltage, red is current and green is power.
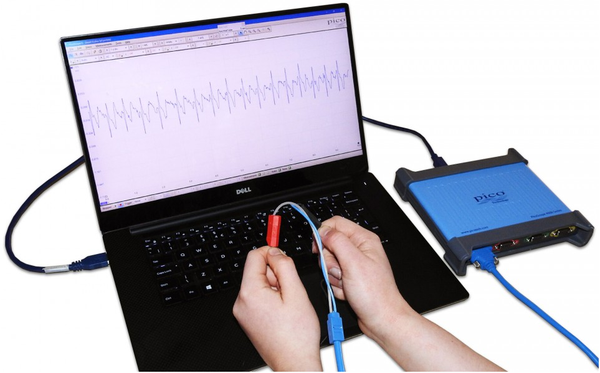
Rejecting common mode noise
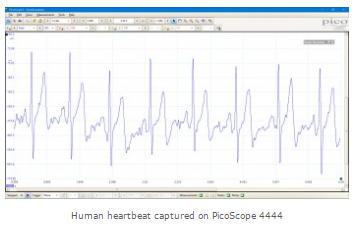
Differential input oscilloscopes measure the difference in signal between their two inputs. This is especially useful when you are trying to measure low-level signals in electrically noisy environments.
In this example we capture a human heartbeat simply by holding one input connector in each hand.
Standby power measurement
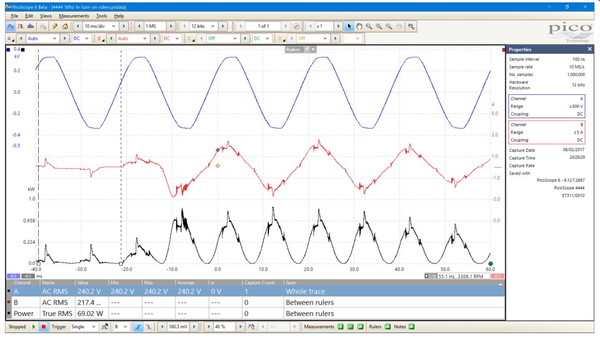
Many electronic devices today are left in sleep mode until instructed to wake up and function as normal. Most TVs are in standby mode until we arrive home and punch the “power” button on the remote control to watch the football game. It is important to measure the current a device is consuming in standby mode to ensure it complies with relevant energy efficiency standards.
This older TV consumes 69 W in standby mode (over 600 kWh per year). More modern TVs consume less than this when operating and under 1 W in standby.
When switch-on occurs we need to observe the power-up timing characteristics, inrush current and other parameters. There is normally a big difference between “standby” and “on”, so measurements must be made with high resolution to match the large dynamic range of the two states. The PicoScope 4444, with 12 to 14-bit resolution, is ideal for making such measurements.
The measurement was made using a PicoConnect 442 1000 V CAT III voltage probe and a TA300 40 A current probe.
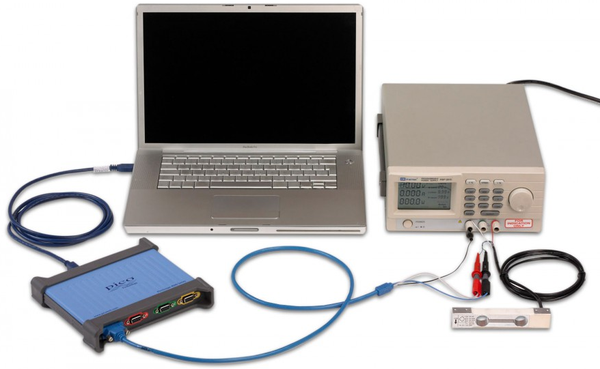
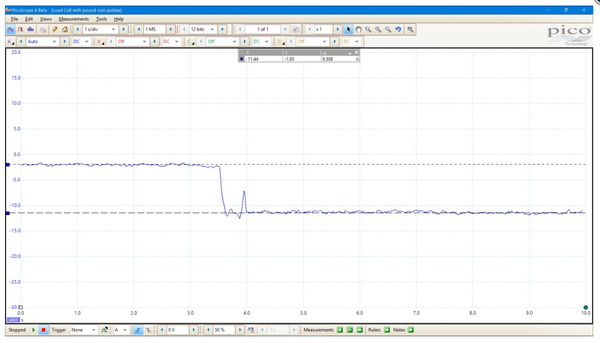
Load cells and strain gauges
Many sensors such as load cells, pressure sensors and strain gauges respond by changing resistance and are usually wired in a bridge arrangement.
The 4 wire 1 kg load cell shown here is a typical example. It is excited by a 10 V DC source (in this case from a bench power supply).
The output is a small 1 mV per gram differential signal riding on a 5 V common mode signal. The differential inputs of the PicoScope 4444 allow direct connection to such sensors.
The 14-bit mode allows a good resolution of weight measurement. In this example one voltage range can cover the whole 1 kg range yet still resolve changes of less than 0.1 g.
The fast sampling rate allows transient events to be captured that most data acquisition devices are too slow for.
The waveform shows the effect of dropping a small coin onto the load cell. Once it has settled we can use the rulers to measure the weight as 9.5 g.
Load cells output recorded on a PicoScope 4444
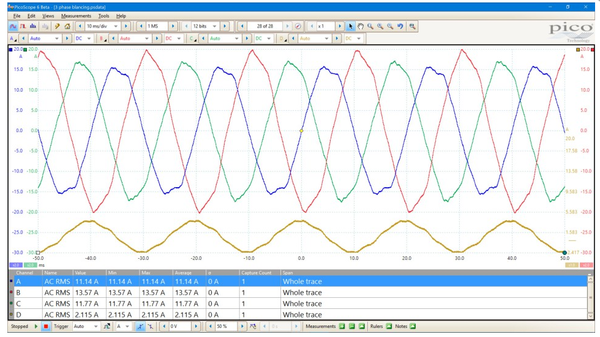
Three-phase load measurements and balancing
It is good practice to ensure phases are equally balanced. The waveform shown was captured using the PicoScope 4444 and four TA300 current probes. The probes are identified and powered by the oscilloscope making them ideal both for short-term and long-term monitoring of load balance.
The phase represented by the red trace is drawing about 17% more current than the other two. The effect of this can be seen in the current flowing in the neutral line (bottom trace).
One phase (red trce) is unbalanced causing a current to flow in the neutral line (bottom trace)
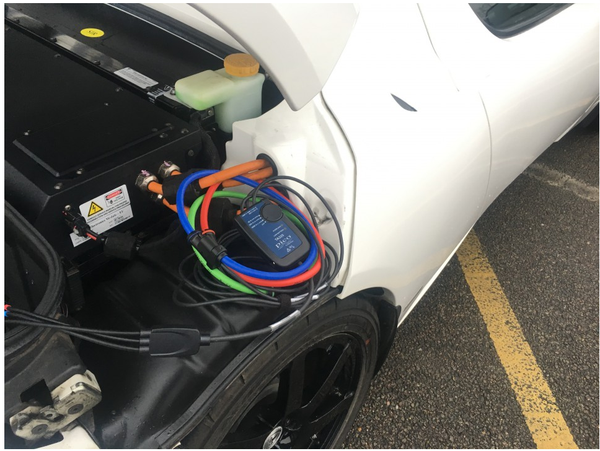
Hybrid and electric vehicle (EV) applications
The PicoScope 4444 is ideal for making measurements on hybrid and electric vehicles. Voltage ranges up to 1000 V (CAT III rated) allow direct measurements of battery, inverters, motors and chargers. A range of single and three-phase current clamps measure up to 2000 A.
The deep memory, high resolution and powerful zoom tools reveal hidden details in waveforms.
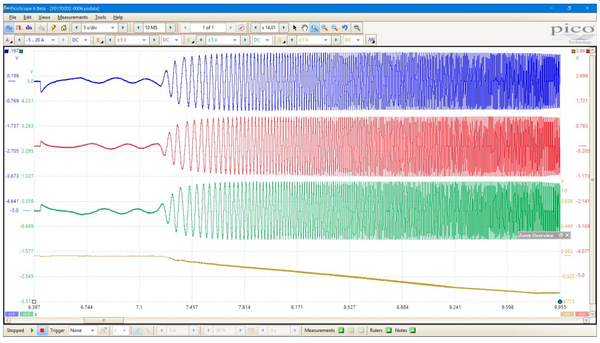
Away from the high voltage components, the PicoScope 4444 can capture waveforms from sensors and actuators and also decode automotive serial signals (CAN, CAN FD, LIN and FlexRay).[Tesla motor and battery waveforms]Red, green and blue traces show current drawn by 3-phase motor. Brown trace is current drawn from battery.
The waveform captured from a Tesla Roadster shows current drawn by the three-phase motor during acceleration from standstill. The brown trace shows current drawn from the 375 V battery pack: peak current is 590 A.
Red, green and blue traces show currrent drawn by 3-phase motor. Brown trace is current drawn rom battery.
English
Français
Deutsch
Italiano
Español
ä¸æ–‡ (简体)
í•œêµì–´
日本語
1
4 MB
March 15 2017
PicoScope 4444 oscilloscope accessories
D9 differential voltage probes
The Pico D9 connected range of accessories connect exclusively with the PicoScope 4444 differential oscilloscope. The scope interface also provides power to the accessory.
Choose either the PicoConnect 441 non-attenuated probe for measuring low-amplitude signals, or PicoConnect 442 25:1 attenuated probe for making safe cost-effective differential voltage measurements up to 1000 V CAT III.
PRODUCT
PRICE
PicoConnect 441 1:1 differential probe PQ098
PicoConnect 442 25:1 differential probe (1000 V CAT III) PQ087
D9 current probes
The Pico D9 connected range of accessories connect exclusively with the PicoScope 4444 differential oscilloscope. The scope interface also provides power to the accessory.
Both TA300 and TA301 current probes use Hall effect technology to sense AC and DC currents. The TA300 is a 40 A probe suitable for measuring signals from DC to 100 kHz. It is a precision probe for smaller currents and can resolve to a few milliamps. The TA301 is a switched-range 200/2000 A probe suitable for measuring signals from DC to 20 kHz bandwidth.
PRODUCT
PRICE
40 A AC/DC current probe, D9 connector TA300
200/2000 A AC/DC current probe, D9 connector TA301
The Pico D9 connected range of accessories connect exclusively with the PicoScope 4444 differential oscilloscope. The scope interface also provides power to the accessory.
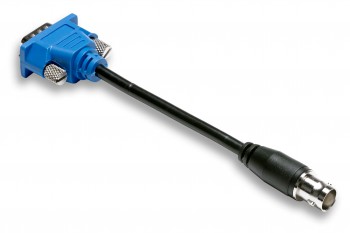
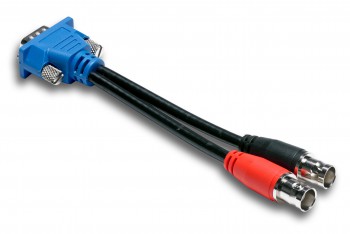
The TA271 and TA299 adaptors allow you to use the PicoScope 4444 with traditional BNC-connected accessories.
PRODUCT
PRICE
D9 to single BNC adaptor TA271
D9 to dual BNC adaptor TA299
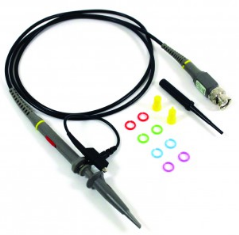
Passive oscilloscope probes
from 60 MHz to 9 GHz
Our ergonomically designed passive oscilloscope probes are suitable for use with all major brands of oscilloscopes as well as the PicoScope range of USB Oscilloscopes. Passive probes don't require a power supply or batteries so are lightweight and easily portable.
Read our free guide: How to Tune x10 Oscilloscope Probes.
PRODUCT
PRICE
60 MHz high-impedance passive probe 1:1/10:1 with BNC MI007
Current probes (clamps)
Clamp-on current probes or “current clamps” enable you to measure currents without breaking the electrical circuit. Current clamps are designed with jaws that can be opened, placed around the conductor and clamped shut to form a magnetic loop around the conductor.
Current clamps offer a safe, cost-effective, simple and accurate way to take current measurements.
Our range of current clamps can be used with PicoScope Oscilloscopes and PicoLog Data Loggers, as well all major brands of oscilloscopes and multimeters.
PRODUCT
PRICE
30/300/3000 A AC 3-phase flex current probe, BNC connector TA325
30/300/3000 A AC flex current probe, BNC connector TA326
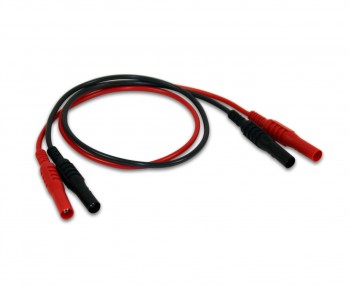
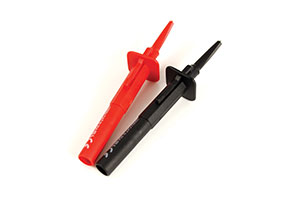
Clips, leads and 4 mm probes
From gator/croc clips to acupuncture probes, here you will find a variety of popular accessories for use with test and measurement equipment.
Our test clips are suitable for general-purpose test and measurement as well as for automotive diagnostics applications. The test clips are designed for use with our range of test leads.
PRODUCT
PRICE
Unshrouded 4 mm sprung hook, black TA327
Unshrouded 4 mm sprung hook, red TA328
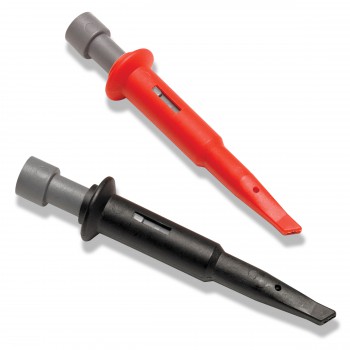
Shrouded multimeter test prod 1000 V CAT III, red TA311
Shrouded multimeter test prod 1000 V CAT III, black TA310
Shrouded 4 mm to 4 mm lead 1000 V CAT III 0.5 m, red TA309
Shrouded 4 mm to 4 mm lead 1000 V CAT III 0.5 m, black TA308
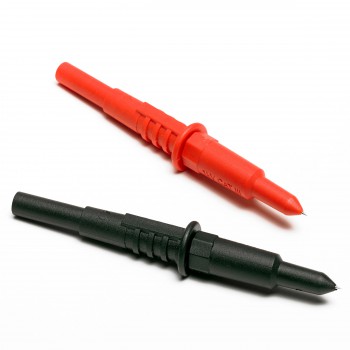
Sprung hook probe 1000 V CAT III, black TA089
Sprung hook probe 1000 V CAT III, red TA090
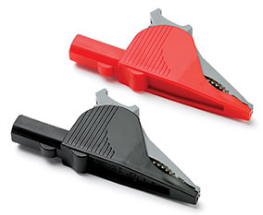
Large dolphin clip, 1000 V CAT III, red TA006
Large dolphin clip, 1000 V CAT III, black TA005
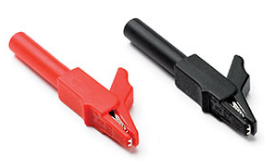
Small crocodile clip, red TA004
Small crocodile clip, black TA003
Miscellaneous
PRODUCT
PRICE
5 V AC power adaptor PS011
CALL TO ORDER
PicoScope 4444 carry case PA149
PicoScope 4444 oscilloscope specifications
Vertical
Oscilloscope specifications
Specifications with PicoConnect 442 1000 V CAT III probe
Input channels
4 channels
4 channels
Analog bandwidth (–3 dB)
20 MHz with D9 to BNC adaptors
15 MHz with PicoConnect 441 probe
10 MHz
Rise time (calculated)
17.5 ns with D9 to BNC adaptors
23 ns with PicoConnect 441 probe
35 ns
Bandwidth limit
100 kHz or 1 MHz (selectable)
100 kHz or 1 MHz (selectable)
Vertical resolution, 12-bit mode
12 bits on most input ranges
11 bits on ±10 mV range
12 bits
Vertical resolution, 14-bit mode
14 bits on most input ranges
13 bits on ±20 mV range
12 bits on ±10 mV range
14 bits
Enhanced vertical resolution
12-bit mode
16 bits on most input ranges
15 bits on ±10 mV range
16 bits
Enhanced vertical resolution
14-bit mode
18 bits on most input ranges
17 bits on ±20 mV range
16 bits on ±10 mV range
18 bits
Input type
Differential
9-pin D-subminiature, female
Differential
9-pin D-subminiature, female
Input characteristics
1 MΩ ±1%, in parallel with 17.5 pF ±1 pF (each differential input to ground).
< 1 pF difference between ranges.
16.7 MΩ ±1%, in parallel with 9.3 pF ±1 pF (each differential input to ground)
Selectable from 128 to half available buffer memory in powers of 2, up to a maximum of 1 048 576 points
Math channels
General functions
−x, x y, x−y, x*y, x/y, x^y, sqrt, exp, ln, log, abs, norm, sign, sin, cos, tan, arcsin, arccos, arctan, sinh, cosh, tanh, derivative, integral, delay
Filter functions
Lowpass, highpass, bandstop, bandpass
Graphing functions
Frequency, duty cycle
Multi-waveform functions
Min, max, average, peak
Operands
Input channels, reference waveforms, time, constants, pi
Automatic measurements
Scope mode
AC RMS, true RMS, frequency, cycle time, duty cycle, DC average, edge count, falling edge count, rising edge count, falling rate, rising rate, low pulse width, high pulse width, fall time, rise time, minimum, maximum, peak to peak
Spectrum mode
Frequency at peak, amplitude at peak, average amplitude at peak, total power, THD %, THD dB, THD N, SFDR, SINAD, SNR, IMD
Beep, play sound, stop capture, save waveform, trigger signal generator / AWG, run executable
Display
Interpolation
Linear or sin(x)/x
Persistence modes
Digital color, analog intensity, custom, fast or none
SDK/API*
Supplied drivers
32- and 64-bit drivers for Windows 7, 8 and 10
Linux drivers
Mac OS X drivers
Example code
C, C#, Excel VBA, VB.NET, LabVIEW, MATLAB
Maximum sampling rate (USB streaming)
50 MS/s
Capture memory (USB streaming)
Up to available PC memory
Segmented memory buffers
> 1 million
Specifications for users writing their own software. See "Oscilloscope – horizontal" above for specifications when using PicoScope 6 software.
General
Package contents
PicoScope 4444 precision differential USB oscilloscope
Quick Start Guide
Universal mains power supply
USB 3.0 cable 1.8 m
Other accessories as requested at time of ordering
PC connectivity
USB 3.0, compatible with USB 2.0, USB 1.1
Power requirements
USB port or external DC PSU, depending on connected accessories
Dimensions
190 x 170 x 40 mm including connectors
Weight
< 0.5 kg
Temperature range (operating)
0 °C to 45 °C
Temperature range, operating, for quoted accuracy
15 °C to 30 °C
Temperature range (storage)
–20 °C to 60 °C
Humidity range (operating)
5% to 80% RH non-condensing
Humidity range (storage)
5% to 95% RH non-condensing
Altitude range
Up to 2000 m
Pollution degree
Pollution degree 2
Safety approvals
Designed to EN 61010-1:2010
EMC approvals
Tested to EN 61326-1:2013 and FCC Part 15 Subpart B
Environmental approvals
RoHS and WEEE compliant
Software
PicoScope 6 for Windows, Windows SDK and example programs
PC requirements
Windows 7, 8 or 10, 32-bit or 64-bit. Hardware requirements as operating system.
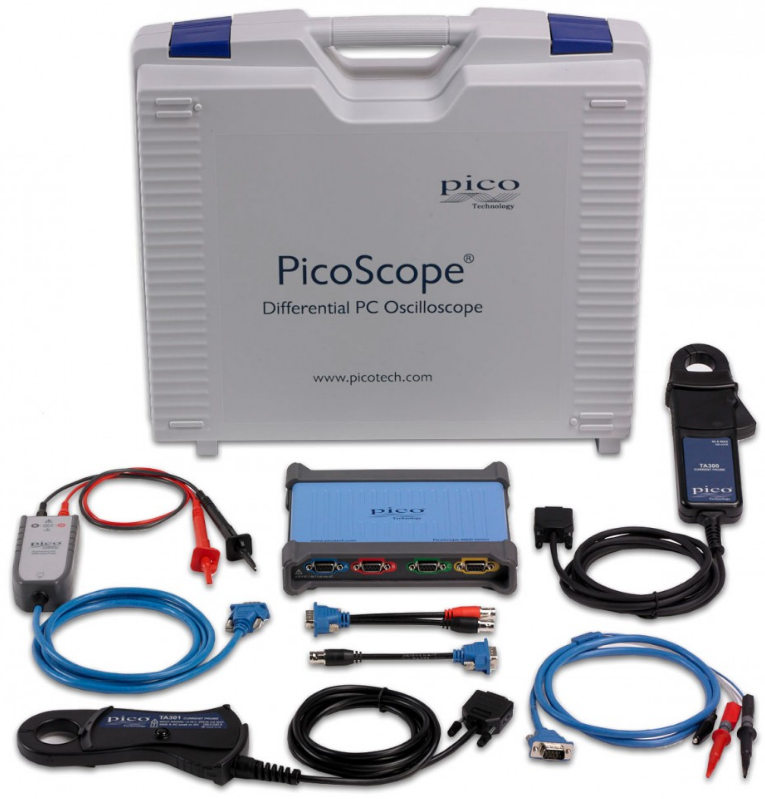
PicoScope 4444 standard differential oscilloscope kit (PQ073) What is in this Kit
Kit Includes 4444 Scope, 3 x PQ0981:1 differential probe and 1 x TA271 D9 to BNC Cable
PicoScope 4444 1000 V CAT III differential oscilloscope kit (PQ074)
[Mains Voltage Kit] - What is in this Kit
Kit Includes 4444 Scope, 3 x PQ08725:1 differential probe and 1 x TA271 D9 to BNC Cable
PicoScope 4444 oscilloscope (PQ088)
This part number is for the 4444 Scope with PicoScope Software and USB Interface Cable. No probes
PicoScope 4444 1000V CAT III mains current and voltage kit (PQ167) What is in this Kit
The PicoScope 4444 1000 V CAT III mains voltage kit is a high-resolution differential oscilloscope with three PicoConnect 442 25:1 passive differential voltage probes rated at 1000 V CAT III and one TA271 single-ended D9-BNC adaptor. The PicoScope 4444 uses specially designed passive voltage probes that have smaller and lighter interface boxes that allow it to make multiple differential measurements at the same time, while taking power from the Pico D9 intelligent probe interface. The Pico D9 interface automatically configures the PicoScope display to the correct probe range.
USA Office
Tel:1.877.902.2979-1.425.223.4311
Fax:1.877.329.4324
Address: 1480 Gulf Road, Suite 837,
PO Box 1364
Point Roberts, WA 98281
Western Canada - Vancouver BC
Tel:1.800.663.6001 or 1.604.925.6150
Fax:1.604.925.6170
Address: 2454 Haywood Ave
West Vancouver, BC V7V 1Y1
Eastern Canada - Markham, Ontario
Tel:1.800.465.0164 or
1.905.513.7027
Fax:1.877.329.4324


 Application note: