


The vehicle was tested many times with no obvious problem noted. Good battery voltage, good starter response, seemingly good cranking RPM; not much to report. The engine was tested cold and then left running for a while to see if temperature was an issue, but the customer’s complaint just wasn’t present. It got to the stage where the vehicle’s battery was beginning to suffer, so it was looking as if the car would be returned to the customer with “fault not present” written on the job card.
One remaining check was to get a capture of the starter motor operation through the eyes of a scope. A good all-round check is to look at motor current draw against solenoid exciter command (supply voltage or current draw), because it’s useful to see these factors interact. To get the most accurate record of solenoid supply voltage, it would be ideal to collect these readings close to the starter unit itself, but the unit is mounted on the underside of the drivetrain. Gaining access requires waiting for a spare ramp and then removing an entire engine bay undertray, which is time-consuming. In this game there is a constant pressure for diagnostics to be time-efficient. Signal waveforms recorded by a scope are often bursting with information, and if analysed properly, can either eliminate a component failure or prove it.
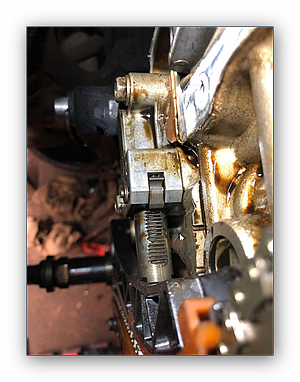
On this vehicle model, mounted behind the left-hand seat, is a battery positive distribution block where the starter supply cable joins; an area that also houses the starter exciter cable. A great second option for a starter motor test location.


This was the result. Channel A (blue) is monitoring solenoid supply voltage and channel B (red) is monitoring motor current. There’s something very wrong with this one.
Let’s look at the same capture in more detail.

The overall structure of the capture contains abnormal signal drop-outs throughout the entire cranking event. Nevertheless, the trace still shows recognisable features of normal starter motor operation.
Capture begins with the starter solenoid receiving a 12 V exciter signal. This closes the internal contacts, simultaneously throwing a pinion drive into mesh with the flywheel and supplying battery voltage to the motor to begin cranking. Note the delay of about 50 ms between exciter feed and motor current: this is the response time of the solenoid. Any long delay here would indicate that the solenoid winding is receiving voltage but the motor isn’t reacting quickly enough; likely causes would include poor internal solenoid contacts or a possible motor ground path problem. Taking any suspicious readings here further, solenoid current draw would be analysed to see if an adequate magnetic field is being generated. This of course is just an example, as the delay time here is normal.
The cranking pattern is easy to see in the motor current waveform. On a good capture we are looking for relatively smooth and even peaks within the trace, each peak correlating with one cylinder as it approaches TDC on compression. There is a moderate current as the motor pushes a piston up its chamber, then a higher current as the piston stroke begins compression and the motor has to work even harder to compress the chamber’s fuel/air mixture.
Behind this simple explanation is a more detailed theory of how the motor draws current depending on its mechanical load. Briefly, the motor creates an electromotive force (EMF), increasing with speed, in the opposite direction to the voltage supplying it. This reverse EMF reduces the current flowing into the motor. The heavier the load on the motor, the slower it runs, so the smaller the reverse EMF and the higher the current. Each cylinder’s compression directly matches each current peak, and a noticeably low, high or uneven peak should raise questions about that cylinder’s compression efficiency. It’s also possible to identify the offending cylinder by displaying the cranking trace against any cylinder's coil signal; now just count along the number of cranking current peaks in accordance with that engine’s firing order until the suspected cylinder is named and shamed. With a good sample rate on the scope trace and a decent current probe, you’d be surprised how accurate this technique can be at spotting potential problems, but I would never consider it a replacement for mechanical compression and cylinder leakage checks.
Lastly, we see the general trend of the current signal falling at the end of the trace to a negative value. This is because, when the engine fires, a current flows from the generator towards the battery, in the opposite direction to the motor current. When the motor current intermittently drops to zero, the sum of these two currents becomes negative. Referring back to the basic schematic it can be seen that the test point where our readings have been recorded also includes generator output.

Here is the last part of the captured trace shown in more detail. Just before testing, the current probe was finely adjusted to 0 A, enabling any measured current flow to be centred on the 0 A line (just good working practice).
Ignore the voltage trace on the exciter line for a moment. As the motor rotates, current is naturally being drawn from the battery; here it’s displayed as positive current flow. Suddenly the engine begins to fire and the generator starts producing current in the opposite direction along the same cable. The probe picks this up and we see a current value starting to appear on the other side of 0 A line; this is energy being put back into the battery.
If the capture is analysed carefully, the peak-to-peak current draw from the battery is actually decreasing slightly as the motor robs current from the generator’s output that would otherwise be heading to the battery. Of course this interaction between battery, starter motor and generator during cranking occurs pretty quickly so there is no danger of the generator being burdened too much. This is one reason why the generator is designed to produce current only above normal cranking RPM.
The focus of the investigation turned to the signal drop-outs themselves. To put the captured signals in perspective, we need to remind ourselves what we are looking at in relation to the starter motor itself.