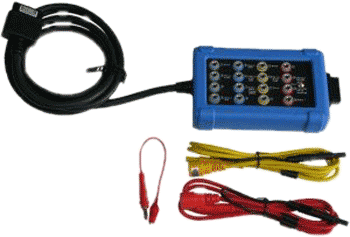
I was fortunate enough recently to get hold of a WPS500X Pressure Transducer and looked forward to using it right away. It didn't take long before I found a perfect excuse to switch it on: the Variable Nozzle Turbine (VNT) boost control.
What seems a recent boom in VNT and Variable Geometry Turbocharger (VGT) applications has actually been around a lot longer than most people realise, with claims of who was the first to introduce it in mass production dating back to the late 1980s. Where the humble wastegate simply diverts exhaust airflow away from its turbine, VNT units control boost delivery in a very different way. By the use of moving vanes placed around the circumference of the exhaust turbine, these vanes can alter the speed at which the exhaust airflow hits the turbine and consequently vary the generated boost in the inlet.
A few benefits over the wastegate setup are reduced turbo lag, increased boost delivery at low loads, and operation largely independent of engine speed/load. There are also inherited Exhaust Gas Recirculation (EGR) benefits due to the exhaust backpressures created as a direct result of this VNT operating principle, so it's easy to see why this new design was adopted. However, the technology isn't without its flaws. After a few years of use (especially from fuel-saving "Steady Eddie" drivers), carbon deposits build up around the vane mechanism causing it to seize, therefore allowing boost to deviate from normal.
Highlighting a suspected problem with a VNT turbo can be a relatively straightforward task, and this is one fault find where the scan tool plays a big part. It can inform the technician of multiple parameters surrounding boost control, enabling a decision to be made as to where to focus the test plan. Not forgetting of course reading any Diagnostic Trouble Codes (DTCs) that log the area in which the Engine Control Module (ECM) reported a problem. There was little call for oscilloscope work - until now.
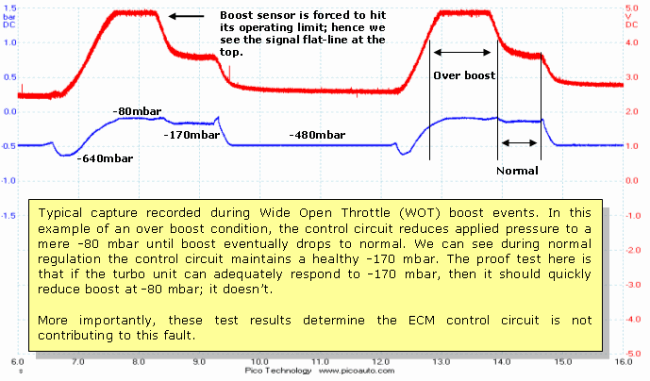
Taking a general case, the most common symptom with these VNT units is an overboost condition which the ECM will recognise, log the appropriate DTC, and subsequently drop the vehicle into 'limp mode'. Cycling the key off and on again will usually restore power until the next fault event. But before any conclusion is jumped to, the ECM control circuit must first be tested and verified.

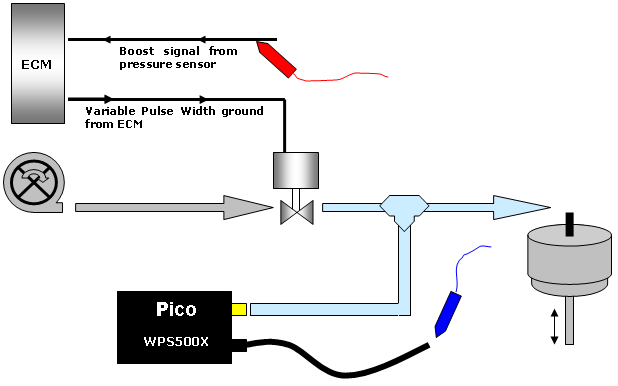
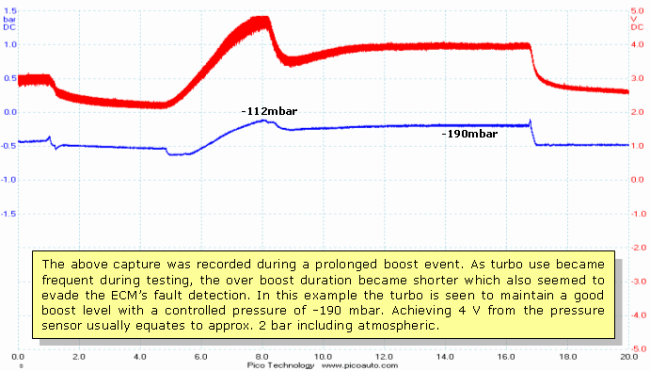
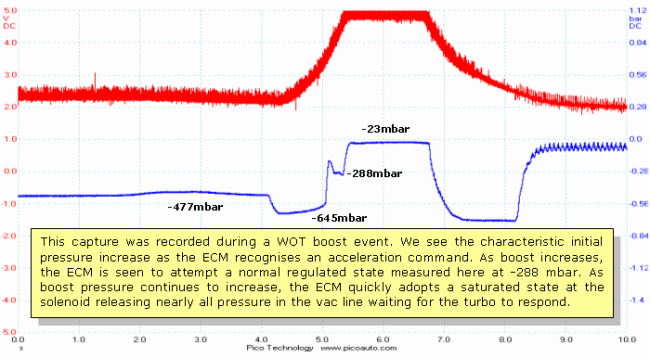
The test plan in theory is fairly simple: by plumbing a vacuum gauge on the solenoid output line we can measure the negative pressure applied to the turbo actuator. When the required boost level is reached (usually 2.0 bar including atmospheric), we expect the ECM to release and regulate pressure applied to the actuator whilst maintaining a suitable boost level. If however the vacuum level correctly falls yet the boost level continues to rise, then we have a problem. I favour this pressure integrity check early in the test plan because it allows us to see what is happening at the end of the control circuit. It's also the cumulative result of that control circuit and can eliminate several checks in one test.
The execution of this test has always been somewhat tricky, keeping one eye on the live boost, and the other eye on a vacuum gauge, plus needing a workmate to drive the car. Oh, and no record of the fault event either. Here's where I found the WPS500X simplified the process. Hooking up the WPS500X and setting the scope recording before a road test is simple, quick, and provides a recording of instant correlation to the cause and effect of boost control.
VW Golf 2003 1.9 TDI
Volvo S80 2005 2.4 D5
I've collected several fault-finds using this method and have found that in each case the VNT mechanism was more prone to failing at cool engine temperatures. Once the turbo had been worked several times the fault occurrence became infrequent. Of course this would depend on the severity of the fault.
With future measurements recorded like these, the expected result will most likely mean the turbo is coming off to be dismantled. This method has so far flushed out leaking solenoid valves, and a blocked solenoid waste outlet line - all giving symptoms of a seizing turbo when viewing live data through the scan tool. This is why I favour a physical measurement of the control pressure, and whilst a similar test can be achieved using a vacuum gauge as I have done before, I've also been unaware of the hidden detail within those pressures. This WPS500X is proving to be an excellent learning tool.
PicoScope data files
- Download the PicoScope data files of the waveforms featured in this article:
 Golf 1 (115 KiB) Golf 1 (115 KiB)- Golf 2 (116 KiB)
- Volvo 1 (139 KiB)
- Volvo 2 (148 KiB)
|