Knowing when to say "No!" is something that we learn as we progress through the ranks in the motor repair business, but sometimes we still succumb to the urge to take on an interesting job. We recently had a 2003 BMW M3 drop in on us, with two warning lights displayed and the customer complaining that he kept losing his gears. This car is fitted with an SMG transmission and my knowledge was somewhat limited to be honest. I had read some horror stories, where owners had spent literally thousands of pounds before a fix was found. This really ought to be the job for a BMW dealership or independent specialist, but the masochistic side of me drew me into an interesting diagnostic process.
A global diagnostic scan pulled two significant fault codes. The DME (Digital Motor Electronics or Engine Management System to you and me) had the following DTC and definition... "Engine MIL on at request of SMG". The SMG (Sequential Manual Gearbox) system had the following faults stored... "P1717 Hydraulic Motor On Time too long".
This BMW SMG transmission is essentially a conventional manual gearbox, with an electrohydraulic control system, that has been developed using technology developed for the BMW/Williams Formula 1 car.
When considering the merits of taking on this kind of diagnosis, it is important to weigh up the customer as much as the vehicle. There is little point in proceeding if the owner is going to baulk at seemingly expensive and time consuming test and repair processes. If they are the sort that want the car by the weekend and have only a limited budget, then it's time to walk away. The owner of this car was away in Abu Dhabi for several weeks and had expressed that he "Wanted it fixed!" and authorised a generous spend. Although he knew it could cost thousands to fix it, there was still considerable pressure on us to make sure that parts were not fitted unnecessarily.
Fortunately we have access to a tool with dealer level diagnostic capability and also an excellent technical information system, which is essential if an informed diagnosis is to be made. Control unit software versions were checked and found to be subject to newer version releases. This has become a big part of fault diagnosis in recent years. Faults can be logged due to over strict parameters which can be altered by system developers. In this case, both the engine and transmission controllers were brought up to date. Other system tests were carried out and the hydraulic pump relay was replaced (at the suggestion of the guided fault finding system). I had little faith in the relay being to blame for a prolonged pump run fault, but on the other hand, at only £10 (about US$16) for a component that is directly responsible for powering the pump, it didn't seem unreasonable.
We ran the car for a week without a fault recurring and the owner's brother in law came to collect. Typically ten minutes later, he returned with the exact same fault scenario. Intermittent faults will make the most professional repairer look inadequate! The car was left with us for more testing.
This time we tested and confirmed the accumulator residual pressure. This is done by an automated test plan performed on the diagnostic tool. The hydraulic system is vented and the residual pressure is displayed. We had 32 bar, where the minimum specified pressure is 29 bar. The pressure generation appeared to be reasonable too, taking approximately 20 seconds to build from 50 bar through to 70 bar (the system cycles between these two values).
It was fortunate that an identical car was available to us that we could take some good data readings from. This approach has often been pivotal when tackling complex and rarely seen faults and this time it would prove to be just as helpful. Initially only basic comparisons were made, i.e. pressure generation and decay times were compared in "live data" using a stop watch. This didn't really show anything conclusive, so a new approach was required. There is only one way to study the pump functionality in minute detail and that is with the scope. By capturing the hydraulic pump current signal, during its operation from zero through to 80 bar and comparing to the same capture from the known good car, it was hoped that some conclusive information could be found.
Here is a capture taken of the hydraulic pump current draw. Taken over a 20 seconds (total screen time) and with a 20 amp vertical scale.
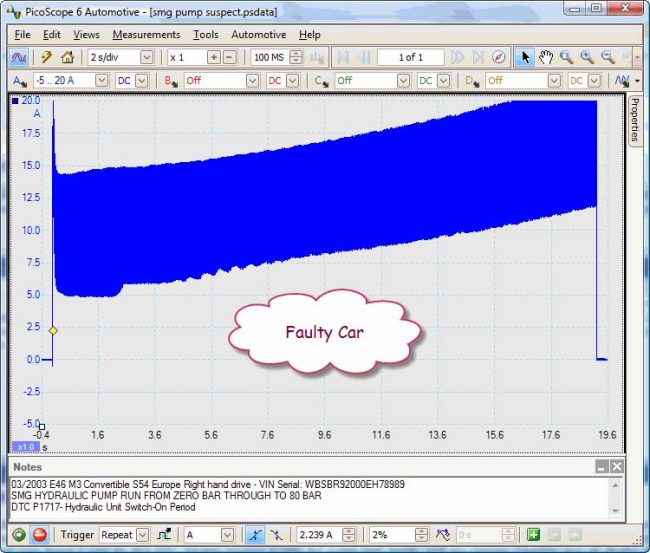
Figure 1: The faulty car

Figure 2: The good car
Looking at the two captures, it is instantly obvious that there are a couple of differences. Firstly the time taken to generate the 80 bar value (pressure values were reported on the scan tool) can be seen to be approximately 8 seconds quicker on the good car. Secondly, the vertical scale of the capture appears to be quite "noisy" on the faulty car capture. Look at the narrower signal (Figure 2) on the good car. This could be a fault and we really need to zoom in and understand what is happening here.
Before we zoom in, it should be highlighted that it is important to make sure that when comparing values from two vehicles, the test conditions are as close as possible in each instance. Both cars had been left for several hours, so that the pressures had decayed to zero and just as importantly, the temperature of the hydraulic fluid had settled to an ambient level. This is important as it would be pointless trying to compare pressure development times if one car had hot fluid and the other had cold. The viscosity of the fluid will likely influence the pump's ability to develop pressure, but also it will affect the time it takes the fluid to leak or decay away past the numerous actuators, valves and solenoids.
OK now for closer inspection, with the same capture as before, but this time zoomed in 512 times (horizontally)...

Figure 1: The faulty car zoomed

Figure 4: The good car zoomed
In the two previous captures, we have zoomed in (X 532) to the point where we can see the individual current events associated with each segment on the pump motor commutator ring. In the close up of the poorly car (Figure 3) we can see a curious signature that is repeated in each rotation and also a repetitive cycling of the overall current draw. Compared to the consistent signal from the good car (Figure 4), we can see that we have an issue.
Initially it was not clear whether the undulations in the overall current were a result of a problem with the pump/motor assembly itself, or perhaps due to fault elsewhere in the hydraulic system. Perhaps a poor seat on a valve might cause an uneven load on the pump motor and this might cause the irregular current curve? Whatever, this assembly costs nearly £1700 (about US$2700) and guesswork is not an option.
There is one important clue to be seen within the capture from the faulty car. You will notice the commutator segment signal with the flat bottom. This signature pattern is repeated over and over throughout the whole waveform and in each instance it is in the same dip in the cycling current. This is important, because it ties the rise and fall in current undisputedly to the rotational position of the pump motor. It suggests that the rise and fall in current draw is caused by an issue local to the pump motor or pump itself.
With this new information, the new part was ordered and after fitting and bleeding the system, a repeat capture was made, so that the repair could be confirmed. As you can see, the system now resembles that of the known good car.

Figure 5: The repaired car

Figure 6: The repaired car zoomed
Conclusive I think!
The car has been with the customer for a while now and he has emailed me to express his gratitude. It now drives very differently to the troublesome car that was presented to us and some of that should be attributed to the latest software that we loaded.
This is another example of why scope use is essential in the job today. The evidence is obvious and the final proof of repair is important. The parts alone associated with this repair cost £1470 (about US$2300) VAT. This is not the sort of arena to be practising in "best guess" diagnostics and again PicoScope has played a fundamental role in the process of doing the job properly. I don't see that I would have ordered the parts, without the information gained from the scope evaluation and I wonder if the dealers go in this deep?
After owning PicoScope for just four years and with no previous oscilloscope experience, the benefits of ownership are clear to see. The way that signals can be captured over very long time bases and then manipulated so that the fine detail can be studied is fantastic. If you want to step up to the challenge of the modern job and gain an advantage, it really is a "no brainer!"
|