|
There can't be many workshops that have not seen the DTC (Diagnostic Trouble Code) P0420 Catalyst efficiency below threshold. It is becoming something of an epidemic these days and the fiercely competitive catalyst market has driven down the quality of the after-market product to the point that, at best, you would be lucky to pass your MOT emissions test the following year. Disputes with suppliers are not uncommon and often the supplier will argue that the vehicle has underlying issues that have not been addressed. This might be true in some instances, but we need to prove our case, if we are to fix the car without being "out of pocket"!
As of August 13th 2009, a new regulation came into effect that makes it an offence in the UK to sell or install a non-approved catalyst to a car or light commercial first registered after March 1st 2001. Hopefully this will bring an end to the misery and expense that affects both customers and workshops. In the meantime we need to know how to diagnose and recognise a failed or partially failing catalyst.
Some scan tools have the capability to display live data in a graphed format and this can give you the information you need. However, not all scanners have this function and sometimes we are left with just OBD coverage as our only source of info! Fortunately, modern technology plays into our hands a little here and with the use of the oscilloscope we can utilise the downstream Oxygen Sensor signal to tell us how well the catalyst is performing.
Although we are seeing many instances where various types of Wide Band Oxygen Sensors are fitted in the pre-catalyst (upstream) position, generally we will encounter a conventional Zirconium Dioxide type Oxygen Sensor fitted in the post-catalyst (downstream) location. This is helpful, as the major function of this sensor is to provide information to the Engine ECU about catalyst performance.
Once a fully functional catalyst is up to working temperature and is "lit", we should see a nice "flat line" signal from the downstream sensor, which shows that the exhaust gases have been successfully converted. If you were to remove the catalyst altogether, both Oxygen Sensors would report the same condition, although the downstream sensor would display a delayed reaction due to its location and might also take a while longer to reach operating temperature. What we need to do in our diagnosis is recognise the difference between these two conditions and make a judgment about the efficiency of the catalyst.
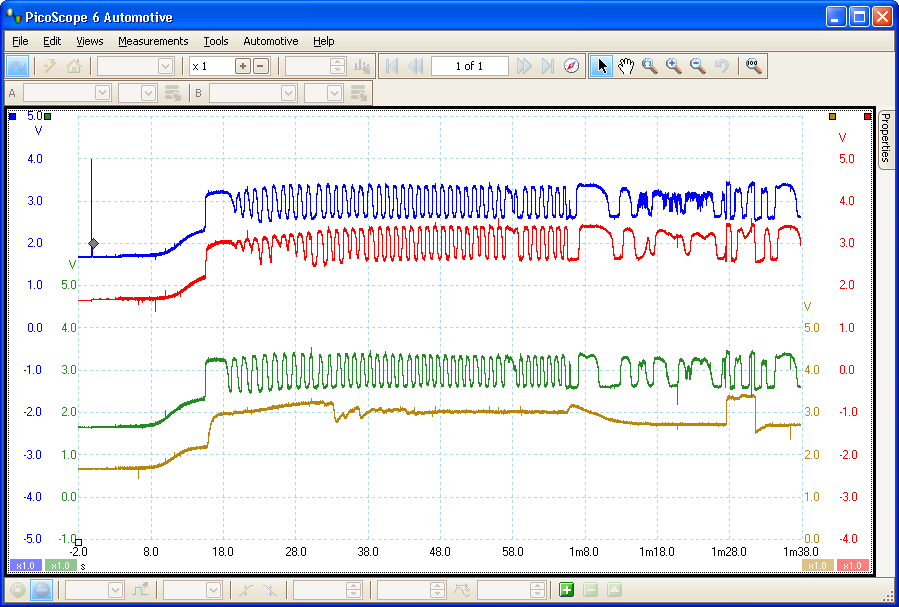
Recently I had a 2003 Dodge Ram 4.7 litre V8 booked in with the MIL (Malfunction Indicator Light) reporting a problem. With only OBD connectivity I managed to pull P0420 catalyst efficiency bank 1. In the following waveform I am monitoring the output of both upstream and downstream Oxygen Sensors from each bank, taken from "key off" to start-up and straight away to fast idle (2,500 RPM). We can see clearly the difference between a good a bad catalyst, as the signal on channel D (in yellow) displaying a successfully converted exhaust gas, as opposed to the red signal that almost mirrors the signal from the pre-cat sensor (in blue).
 View larger image View larger image
It is also useful to observe the reaction time of all the sensors during this type of test and, with repeated "snap throttle" events, it is possible to verify that the sensors are functioning correctly. This is a vital point and one that can add a lot of weight to your case against the supplier of the under-achieving catalyst. Armed with this information and also confirmation of fuel trims and the printout from your gas analyser, you will find that your point is proven.
Over time, you will come to learn the differences between a good, bad and even a marginally performing catalyst, by observing the downstream O2 sensor behaviour through varying engine speeds. Often you will see a catalyst take extended preconditioning periods before it achieves "light off". Other times you will see a catalyst that copes well with gas flow at low engine speeds, but starts to show minor symptoms as the gas flow rate increases at a higher RPM.
The waveform below explains what information can be drawn from a simple capture.
View Video -->
It is hard for anyone to argue with a conclusive waveform printout as displayed above. It really does speak for itself, I think.
 Download the PicoScope data file of the waveform featured in this article Download the PicoScope data file of the waveform featured in this article
(970 KiB - about 3 mins @ 56 kbps)
|