|
|
||||
| Log In | ||||
|
| ||||
| ||||
| ||||
| ||||
| ||||
Start PicoScope software, click Auto setup and your PC is transformed into a powerful large-screen oscilloscope with the timebase and triggering already set up. Click Persistence mode for rapid screen updates with variable intensity for viewing complex analog signals or spotting digital glitches. Click Spectrum mode and your PC becomes an FFT spectrum analyzer. And there’s much more...
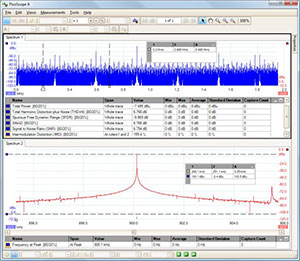
Spectrum analyzerWith the click of a button, you can display a spectrum plot of selected channels up to the full bandwidth of the oscilloscope. A comprehensive range of settings gives you control over the number of spectrum bands, window types and display mode: instantaneous, average, or peak–hold. PicoScope software allows you to display multiple spectrum views with different channel selections and zoom factors, and see these alongside time-domain waveforms of the same data. A comprehensive set of automatic frequency-domain measurements can be added to the display, including THD, THD N, SINAD, SNR and IMD. You can even use the AWG and spectrum mode together to test the frequency response of a circuit. More information on spectrum analyzer >> 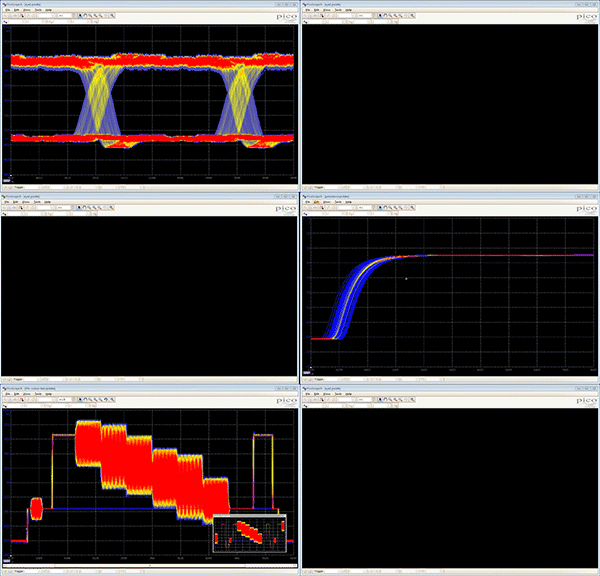
Color persistence modesSee old and new data superimposed with rapid waveform update rates. New or more frequent data can be displayed in a brighter color or shade. This makes it easy to see glitches, jitter, noise, trends and dropouts and estimate their relative frequency or occurence. Choose between analog persistence, digital color or custom display modes. More information on color persistence modes >>
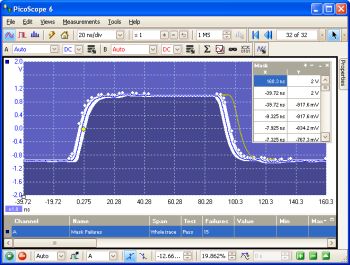
Mask limit testingMask limit testing is used to compare a waveform to a mask, looking for where the signal under test violates the mask. Mask limit testing is useful for long-term signal monitoring, characterising signals during design, or testing on a production line. Simply capture a known good signal and either manually draw a mask around it or autogenerate with user defined tolerances at the click of a button. PicoScope will capture any intermittent glitches and can show a failure count and other statistics in the Measurements window. The waveform buffer overview can also be used to display only those waveforms that failed the mask. Mask testing can also be combined with the alarm function - each time a waveform fails the mask test you can set PicoScope to perform a function such as save the waveform to disk, play a sound or even output a waveform from the signal generator. Mask testing can be performed on both time-domain and spectral displays. With mask limit testing, conducting pass/fail tests in search of waveform anomalies such as glitches has never been easier. More information on mask limit testing >> 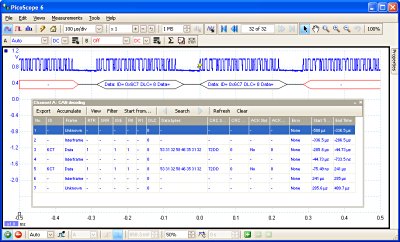
Serial decodingThe PicoScope 2200A Series oscilloscopes include serial decoding capability as standard. The decoded data can be displayed in the format of your choice: In view, In window, or both at once.
It is also possible to create a spreadsheet to decode the hexadecimal data into user-defined text strings. Currently PicoScope can decode I²C, RS232/UART, SPI, I²S, FlexRay, LIN and CAN bus data. Expect this list to grow over time with future software upgrades. More information on serial decoding >> 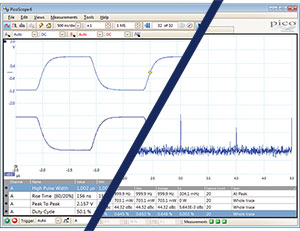
Automatic measurementsPicoScope allows you to automatically display a table of calculated measurements for troubleshooting and analysis. Using the built-in measurement statistics you can see the average, standard deviation, maximum and minimum of each measurement as well as the live value. You can add as many measurements as you need on each view. Each measurement includes statistical parameters showing its variability. More information on automatic measurements >>
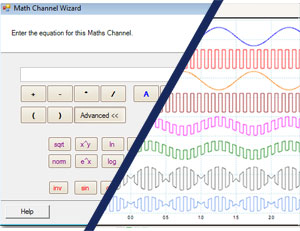
Maths channelsWith PicoScope 6 you can perform a variety of mathematical calculations on your input signals and reference waveforms. Use the built-in list for simple functions such as addition and inversion, or open the equation editor and create complex functions involving trigonometry, exponentials, logarithms, statistics, integrals and derivatives. More information on maths channels >>
Store up to 10,000 waveforms in the bufferEver spotted a glitch on a waveform, but by the time you’ve stopped the scope it has gone? With PicoScope you no longer need to worry about missing glitches or other transient events. Depending on the settings, PicoScope can store up to the last ten thousand waveforms in its buffer. More information on waveform buffer >>  Resolution enhancementResolution enhancement is a technique for increasing the effective vertical resolution of the scope at the expense of high–frequency detail. Selecting resolution enhancement does not change the scope’s sampling rate or the amount of data available. Resolution enhancement adds up to four bits to the effective resolution of your oscilloscope, so a PicoScope 2200 can deliver up to 12 effective bits. More information on resolution enhancement >>
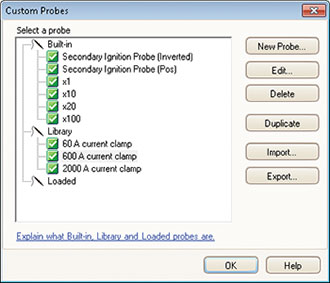
Custom probesThe custom probes feature allows you to correct for gain, attenuation, offsets and nonlinearities in special probes, or to convert to different units of measurement (such as current, power or temperature). You can save definitions to disk for later use. Definitions for standard Pico–supplied oscilloscope probes and current clamps are included.
More information on custom probes >>
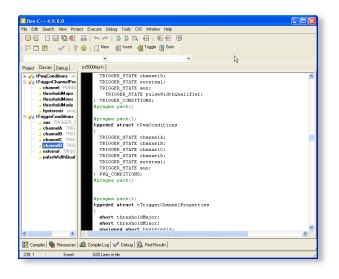
High-speed data acquisition and digitizingThe supplied drivers and software development kit allow you to both write your own software and interface to popular third-party software packages such as LabVIEW and MATLAB. The drivers support data streaming, a mode that captures gap-free continuous data over the USB port directly to the PC’s RAM or hard disk at a rate of 1 to 9.6 MS/s, so you are not limited by the size of the scope’s buffer memory. Sampling rates in streaming mode are subject to PC specifications and application loading.
|
||||||||||||


