The new PicoScope beta release, 6.13, adds Modbus RTU and ASCII to its growing list of serial decoders. Modbus is used in industrial automation to communicate with programmable logic controllers (PLCs).
PicoScope 6 now supports a total of 18 serial protocols and is the only oscilloscope that can decode Modbus.
~~~~~~~~~~~~~~~~~
You can use PicoScope to decode data from a serial bus such as CAN bus. Unlike a conventional bus analyzer, PicoScope lets you see the high-resolution electrical waveform at the same time as the data. RS232/UART and SPI formats added to serial decoding mode
The Picoscope 4424 and 4224 offer both a high resolution (12 bits) and a high DC accuracy (1%) making them an excellent choice for noise, vibration, precision electronics and mechanical analysis.
The optional IEPE interface (see below) allows for the direct connection and powering of industry standard accelerometers and microphones.
High resolution offers 16x more detail
The PicoScope 4224 and 4424 are 12-bit oscilloscopes that offer 16 times more vertical resolution than traditional 8-bit oscilloscopes (4096 vertical levels vs 256). The example shows how with a 12-bit oscilloscope (blue trace) you can zoom in to reveal details of the signal that are not visible on an 8-bit oscilloscope (black trace).
As well as the high vertical resolution, the 32 million sample buffer memory ensures a high horizontal resolution as well. You can collect long detailed captures without the sampling rate dropping.
Once you have seen high-resolution waveforms on a high-resolution PC monitor you will never want to use a traditional benchtop oscilloscope with its small display again.
As well as improved oscilloscope traces, high resolution offers big benefits when performing spectrum analysis offering an additional 20 dB dynamic range on the spectrum over 8-bit oscilloscopes. Signals that were previously hidden in the noise floor are now clearly visible and the spectrum becomes a powerful tool to track down the causes of noise.
IEPE Interface
The PicoScope 4224 is available with an optional internal IEPE (integrated circuit piezoelectric) interface allowing for the direct connection and powering of industry standard accelerometers and microphones.
When disabled the channels can be used as normal oscilloscope inputs. When IEPE is enabled (each channel has independent control via software) the input is AC coupled and a 24 V, 4 mA signal is output to power external sensors.
The high resolution and dynamic range of the 4224 makes it ideal for use with accelerometers and microphones. Having the IEPE interface built in makes for a compact, portable solution.
Advanced display
PicoScope software dedicates almost all of the display area to the waveform. This ensures that the maximum amount of data is seen at once. The viewing area is much bigger and of a higher resolution than with a traditional benchtop scope.
With a large display area available, you can also create a customizable split-screen display, and view multiple channels or different views of the same signal at the same time. As the example shows, the software can even show multiple oscilloscope and spectrum analyzer traces at once. Additionally, each waveform shown works with individual zoom, pan, and filter settings for ultimate flexibility.
The PicoScope software can be controlled by mouse, touchscreen or keyboard shortcuts.
FFT spectrum analyzer
The spectrum view plots amplitude vs frequency and is ideal for finding noise, crosstalk or distortion in signals. The spectrum analyzer in PicoScope is of the Fast Fourier Transform (FFT) type which, unlike a traditional swept spectrum analyzer, can display the spectrum of a single, non-repeating waveform.
A full range of settings gives you control over the number of spectrum bands (FFT bins), window types, scaling (including log/log) and display modes (instantaneous, average, or peak-hold).
You can display multiple spectrum views alongside oscilloscope views of the same data. A comprehensive set of automatic frequency-domain measurements can be added to the display, including THD, THD N, SNR, SINAD and IMD. A mask limit test can be applied to a spectrum for automated testing.
More information on Spectrum analyzer >>
Signal integrity
Most oscilloscopes are built down to a price. PicoScopes are built up to a specification.
Careful front-end design and shielding reduces noise, crosstalk and harmonic distortion. Years of oscilloscope design experience can be seen in improved bandwidth flatness and low distortion.
We are proud of the dynamic performance of our products and, unlike most oscilloscope manufacturers, we publish our specifications in detail. The result is simple: when you probe a circuit, you can trust in the waveform you see on the screen.
Portability
Pico Technology oscilloscopes are small, light and portable. In the lab they take up the minimum of bench space while for the engineer on the move they are small enough to fit in a bag with your laptop.
The USB connection makes printing, copying, saving, and emailing your data from the field quick and easy. The high-speed USB interface allows fast data transfer, while USB powering removes the need to carry around a bulky external power supply, making the scope even more portable for the engineer on the move.
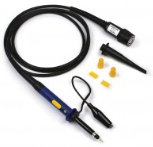
The PicoScope 4424, 4224 and 4224 IEPE are supplied with software, documentation and USB cable. For the 4224 and 4424 a kit also containing oscilloscope probes and a carry case is available.
PicoScope 4224 & 4424 oscilloscope software
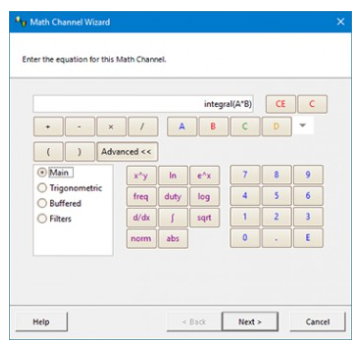
Math channels and filters
On many oscilloscopes, waveform math just means simple calculations such as A B. With a PicoScope it means much more.
With PicoScope 6 you can select simple functions such as addition and inversion, or open the equation editor to create complex functions involving filters (lowpass, highpass, bandpass and bandstop filters), trigonometry, exponentials, logarithms, statistics, integrals and derivatives.
Waveform math also allows you to plot live signals alongside historic peak, averaged or filtered waveforms.
You can also use math channels to reveal new details in complex signals. For example, you can graph the changing duty cycle or frequency of a signal over time.
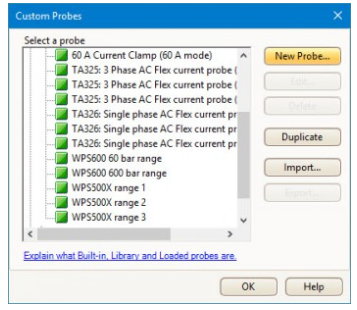
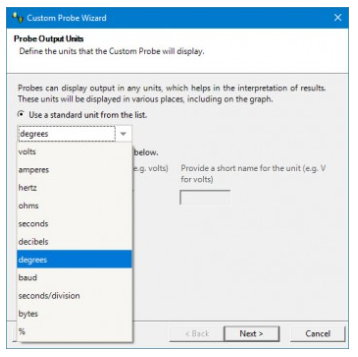
Custom probes
Definitions for standard Pico-supplied oscilloscope probes and current clamps are included in the software.
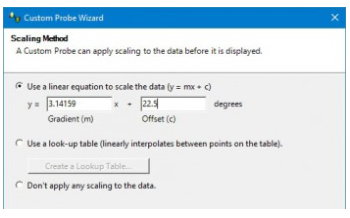
The custom probes feature allows you to correct for gain, attenuation, offsets and nonlinearities in probes, sensors or transducers that you connect to the oscilloscope. For example, it can scale the output of a current probe so that it correctly displays amperes. It can also transform the output of a nonlinear temperature sensor using the table lookup function.
You can save user-created probes for later use.
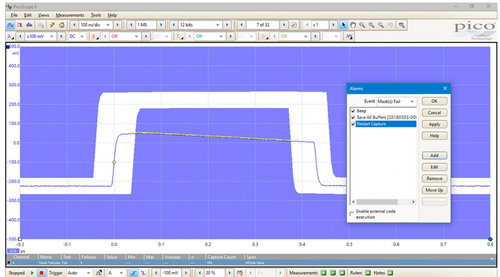
Alarms
PicoScope can be programmed to execute actions when certain events occur.
The events that can trigger an alarm include mask limit fails, trigger events and buffers full.
The actions that PicoScope can execute include saving a file, playing a sound, or executing a program.
Alarms, coupled with mask limit testing, help to quickly validate signal quality in electronic system designs.
High-speed data acquisition and digitizing
The software development kit (SDK) allows you to write your own software and includes drivers for Microsoft Windows and beta drivers for Apple Mac (OS X) and Linux (including Raspberry Pi and BeagleBone).
Example code shows how to interface to third-party software packages such as Microsoft Excel, National Instruments LabVIEW and MathWorks MATLAB.
The drivers support USB data streaming, a mode which captures gap-free continuous data over USB direct to the PC’s RAM or hard disk at rates of up to 20 MS/s. Capture size is limited only by available PC storage. Sampling rates in streaming mode are subject to PC specifications and application loading.
Powerful tools provide
endless options
Your PicoScope is provided with many powerful tools to help you acquire and analyze waveforms. While these tools can be used on their own, the real power of PicoScope lies in the way they have been designed to work together.
As an example, the rapid trigger mode allows you to collect 10,000 waveforms in a few milliseconds with minimal dead time between them. Manually searching through these waveforms would be time-consuming, so just pick a waveform you are happy with and let the mask tools scan through for you. When done, the measurements will tell you how many have failed and the buffer navigator allows you to hide the good waveforms and just display the problem ones. This video shows you how.
Perhaps instead you want to plot changing duty cycle as a graph? How about outputting a waveform from the AWG and also automatically saving the waveform to disk when a trigger condition is met? With the power of PicoScope the possibilities are almost endless.
Processor: Pentium II processor, or equivalent Memory: 64 MB (XP) / 512 MB (Vista) minimum Operating system: Microsoft Windows XP SP2 or Vista (32-bit only) Ports: USB 1.1 compliant port
Recommended
Processor: 2 GHz Pentium IV processor, or equivalent Memory: 256 MB (XP) / 1 GB (Vista) Operating system: Microsoft Windows XP SP2 or Vista (32-bit only) Ports: USB 2.0 compliant port
Environmental
Operating environment Temperature range
0 °C to 45 °C (15 °C to 40 °C for quoted accuracy)
Storage environment Temperature range
Humidity
-20 to 60°C
5 to 95% RH, non-condensing
Physical Dimensions
Dimensions
200 x 140 x 35 mm (approx 7.9 x 5.5 x 1.4 in)
Weight
<500 g (approx 1.1 lb)
General
Supplied software/hardware
PicoScope 6 software (Not Compatible with PicoLog)
Linux drivers (32-bit and 64-bit)
SDK
USB 2.0 cable