High Resolution Oscilloscopes and FFT Spectrum Analyzers
Over the last few years there have been some major changes in the oscilloscope market. Analog scopes have given way to digital storage oscilloscopes (DSOs) and more recently PC Oscilloscopes have become an alternative to conventional ‘benchtop’ oscilloscopes.
The driving force behind DSOs has been digital electronics. As clock speeds in digital circuits increase, manufacturers have responded by designing scopes with faster sampling rates and higher bandwidths. Unfortunately, analogue designers have been left behind: the quest for higher speed has been at the expense of accuracy, dynamic range and precision.
What is a ‘Precision’ DSO?
In digital electronics a signal change of 1% is usually no problem, but in audio electronics 0.1% distortion or noise can be a disaster. Conventional DSOs only offer 8 bit resolution (8 bit ADC), so can detect at best a 0.4% signal change (see table). This means that they are unsuitable for many applications ranging from monitoring sensors and transducers (temperature, current, pressure) to detecting noise and vibration. Precision oscilloscopes require more than 8 bit resolution.
| Oscilloscope resolutions | No of steps | Smallest change that can be detected | Dynamic range |
| 6 bit oscilloscopes |
64 |
1.6% (16000 ppm) |
36 dB |
| 8 bit oscilloscopes |
256 |
0.39% (4000 ppm) |
48 dB |
| 12 bit oscilloscopes |
4096 |
0.024% (244 ppm) |
72 dB |
| 16 bit oscilloscopes |
65536 |
0.0015% (15 ppm) |
96 dB |
As well as resolution, noise is an issue. The amplifiers that make up the ‘front end’ of a conventional DSO are designed to have a high bandwidth. Low noise is not a priority and so 1% noise figures are typical. The designer of a 16 bit oscilloscope has a tough job, noise must be kept below 0.0015% (15 ppm), otherwise the extra resolution will be swallowed up by noise.
Accuracy is not usually regarded as important for most oscilloscopes. You can make measurements within a few percent (most DSOs quote 3% to 5% DC accuracy) but for accurate measurements you have to reach for a multimeter. With precision oscilloscopes, accurate measurements are possible at full speed. Most hand held meters are 12 bit resolution and a 16 bit oscilloscope is equivalent in resolution to a 4.5 digit ‘benchtop’ meter.
Precision Oscilloscopes in Use
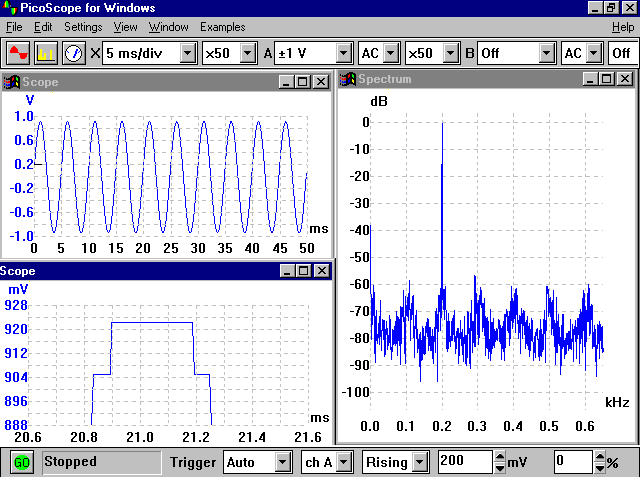
The oscilloscope displays below all show the output of a high quality audio pre amp being fed with a pure sinewave. The output is fairly clean, but has a picked up a small amount of 50Hz mains noise. The first display is an 8 bit oscilloscope (almost all DSOs are 8 bit - Picoscope 3200 series), the second shows a 12 bit oscilloscope (PicoScope 4224) and the third a 16 bit oscilloscope (a Picoscope 4262 16 bit scope).
8 bit oscilloscope example
An 8 bit oscilloscope gives a good visual representation of the wave. From the top left hand view you can clearly see that it is a sine wave and work out its approximate frequency and amplitude. If however, you wish to ‘zoom’ in on the signal to magnify an area of interest, this soon shows up the limitations of an 8 bit oscilloscope. The bottom left trace shows the top trace magnified by x50.
The view on the right shows a spectrum analyser plot (FFT) of the signal. The peak shows the frequency to be exactly 200 Hz. The other signals (approx 60dB down) represent the ‘noise floor’ of the 8 bit scope. To put this into context a typical tape recorder has about 50 to 60 dB of dynamic range. The signal contains 50 Hz noise due to mains pickup, but the 8 bit scope does not have enough resolution to detect it.
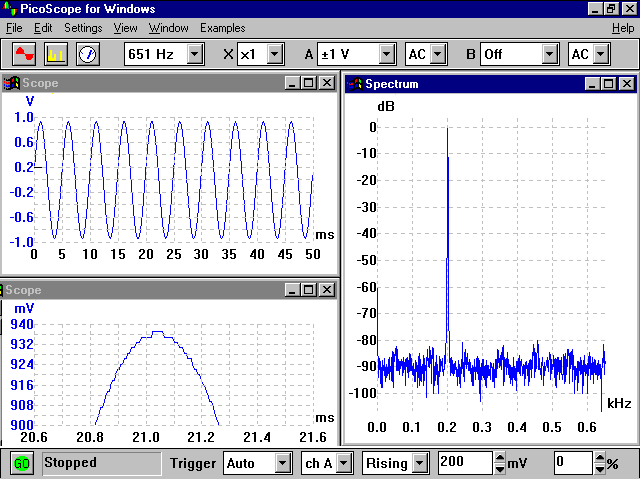
12 bit oscilloscope example
The same signal captured with a 12 bit oscilloscope (PicoScope 4224) looks the same in the normal scope view. The x50 view looks much better, the digitisation ‘steps’ are only just visible. On the spectrum analyser, we still cannot see the 50 Hz noise, but we know that there is at least an 80 dB difference between the signal and the noise. For most audio applications, this is enough (near CD quality) to tell that any noise will not be audible.
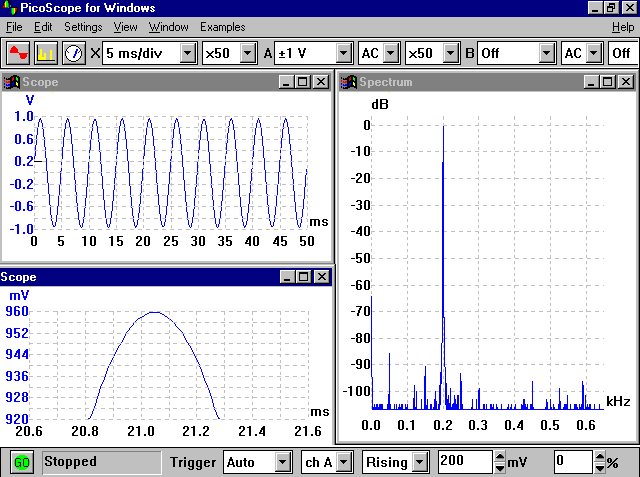
16 bit oscilloscope example
With 16 bit oscilloscopes (Pico 4262), the x50 trace is smooth, with no signs of distortion caused by the digitization. The spectrum trace shows 50 Hz noise (approx 86 dB down) and also harmonics of 50 Hz (at 150 Hz and 250 Hz). To test that the 50 Hz noise was coming from the amplifier not the sinewave source we connected the sinewave directly to the 4262: the 50 Hz peak disappeared.
|