|
The XY oscilloscope mode plots one channel against another on the screen. This plot could be the I-V curve of a component such as a capacitor, inductor or diode, or a Lissajous figure showing the phase difference between two or more periodic waveforms.
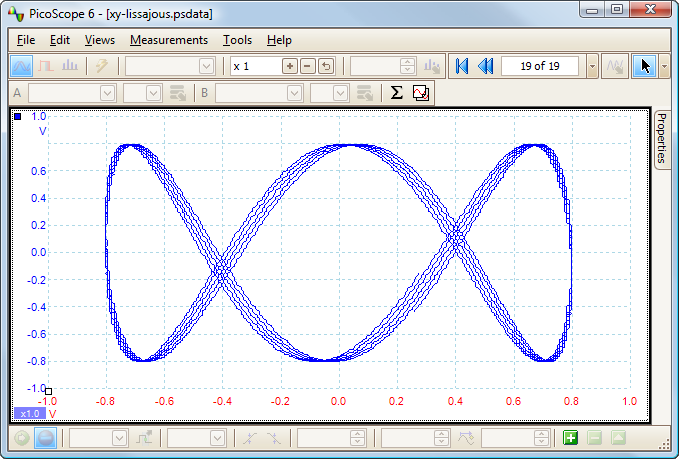
View an animated waveform showing a complete revolution of a Lissajous figure
The XY oscilloscope mode is also capable of more advanced operations such plotting a math channel against a reference waveform, or plotting multiple channels on the Y axis against a single channel on the X axis.
With traditional CRT based oscilloscopes the XY mode was often a cause of concern: if there was a complete loss of signal the CRT's beam would strike a small spot, risking buring the phosphor and damaging the scope. With your PicoScope PC based oscilloscope this concern is eliminated.
Digital persistence mode >
|