


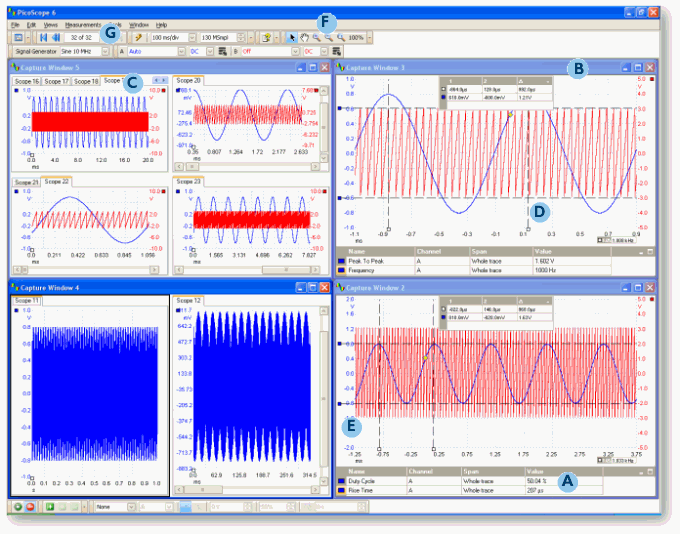
Oscilloscope controls
The display area is kept uncluttered to maximize the data views, commonly used controls such as voltage range selection, timebase, memory depth, channel selection are found on the front panels for quick access. More advanced controls and functions are located within the option menu.
Automatic measurements
The capability to display calculated measurements and parameters for troubleshooting, analysing or visualisation is a powerful feature. Each capture window view can display as many automatic measurements as required.
Powerful visual capture and analysis
Viewing captured data in PicoScope software could not be simpler, but it is also extremely powerful when presenting data in multiple views. The PicoScope software displays waveform data in up to 5 capture windows.
Fully adjustable in size and shape designed to make use of the full size of the computer display. Each capture window can be split into a number of views which allow the data to be presented in a multitude of formats.
Display tools
Rulers: A pair of rulers for each axis can be dragged onto the screen in order to make simple measurements of time, amplitude and frequency.
Axis dragging: The vertical axis of each channel in each view can be adjusted simply by clicking on the axis values and dragging the axis up or down, this feature is particularly useful when data from one channel is obscuring data from another channel.
Advanced zoom and panning tools: You can now enjoy greater freedom and simplicity when manipulating data views by using the suite of browsing and zooming tools. These include the marquee zoom tools where you can simply draw a box around the area you wish to magnify.
Waveform replay tool: PicoScope software now features a circular waveform buffer that automatically records the last 32 waveforms, enabling scrolling and replaying of data, especially useful when trying to find an intermittent event.