Log In

Celebrating 45 Years

Follow us on Facebook for all the latest news, updates and promotions


Attention all
Automotive Scope Users


Pico Automotive Scope software now sports a new Waveform Library browser.
Must own PicoScope to view.
See details here


Credit Cards Accepted


Aurora Probability in Northern Canada

Auroral forecast from AuroraWatch.ca


North America Aurora Map from
NOAA Space Weather Prediction Center

Aurora Map - NOAA


Spectrum Analyzer

spectrumThe spectrum analyzer plots amplitude against frequency. In other words it shows signals in the frequency domain (as opposed to the oscilloscope which shows signals in the time domain - amplitude against time). It is especially useful for tracking down the cause of noise or distortion in measured signals. As an example, a peak at 50 or 60 Hz would suggest noise due to mains pick-up. Higher-frequency peaks may be easily identified as switching noise from power supplies or noise from digital circuits. Average mode is provided to reduce the effects of random noise and Peak Hold mode is useful for testing amplifier bandwidths.


  logo

US Prices


 The spectrum analyzer plots amplitude against frequency. In other words it shows signals in the frequency domain (as opposed to the oscilloscope which shows signals in the time domain - amplitude against time). It is especially useful for tracking down the cause of noise or distortion in measured signals. As an example, a peak at 50 or 60 Hz would suggest noise due to mains pick-up. Higher-frequency peaks may be easily identified as switching noise from power supplies or noise from digital circuits. Average mode is provided to reduce the effects of random noise and Peak Hold mode is useful for testing amplifier bandwidths.

The frequency spectrum is divided into a number of 'bins'. The more bins, the higher the frequency resolution. The maximum number of frequency bins is determined by the number of samples taken. Using a PicoScope 5000 Series Oscilloscope it is possible to have up to 1,048,576 bins and produce a very high-resolution spectrum display.

The PicoScope FFT spectrum analyzer includes window functions (Blackman, Gaussian, triangular, Hamming, Hann, Blackman-Harris, flat-top and rectangular) to reduce unwanted artefacts that are created during the sampling process.
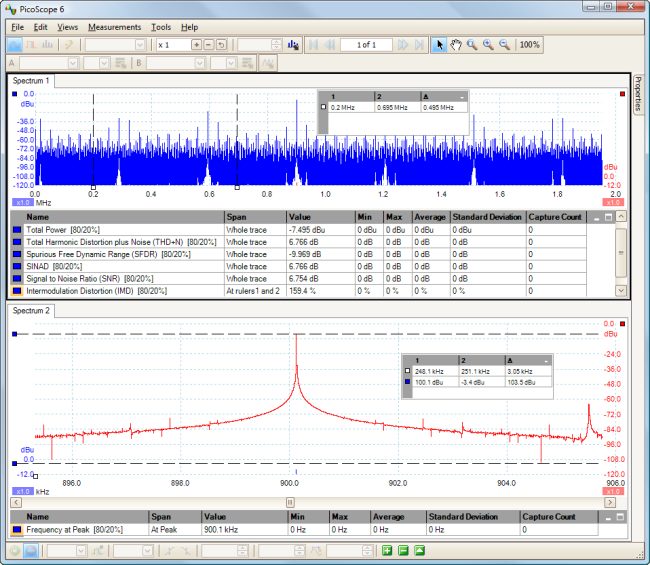
spectrum analyzer


USA Office

Tel:1.877.902.2979-1.425.223.4311
Fax:1.877.329.4324
Address: 1480 Gulf Road, Suite 837,
PO Box 1364
Point Roberts, WA 98281

Western Canada - Vancouver BC

Tel:1.800.663.6001 or 1.604.925.6150
Fax:1.604.925.6170
Address: 2454 Haywood Ave
West Vancouver, BC V7V 1Y1

Eastern Canada - Markham, Ontario

Tel:1.800.465.0164 or 1.905.513.7027
Fax:1.877.329.4324